

Fundamentals of measurement and KPI definitions in e-commerce analytics
The fundamentals of measurement in e-commerce come down to consistent KPI definitions and agreed data sources that will not “argue” with each other. GA4 reports in an event and attribution logic, whereas the store system (e.g. Shopify/Magento) is based on financial transactions, so revenue discrepancies may result from, among other things, cancellations, returns, payment holds or ad blockers. The safest approach is to use “accounting revenue” from the order/ERP system as the source for the result, while treating GA4 as a tool for analysing behaviour and campaigns — and reporting both approaches explicitly. This keeps KPI comparable over time and clear for marketing, e-commerce and finance.
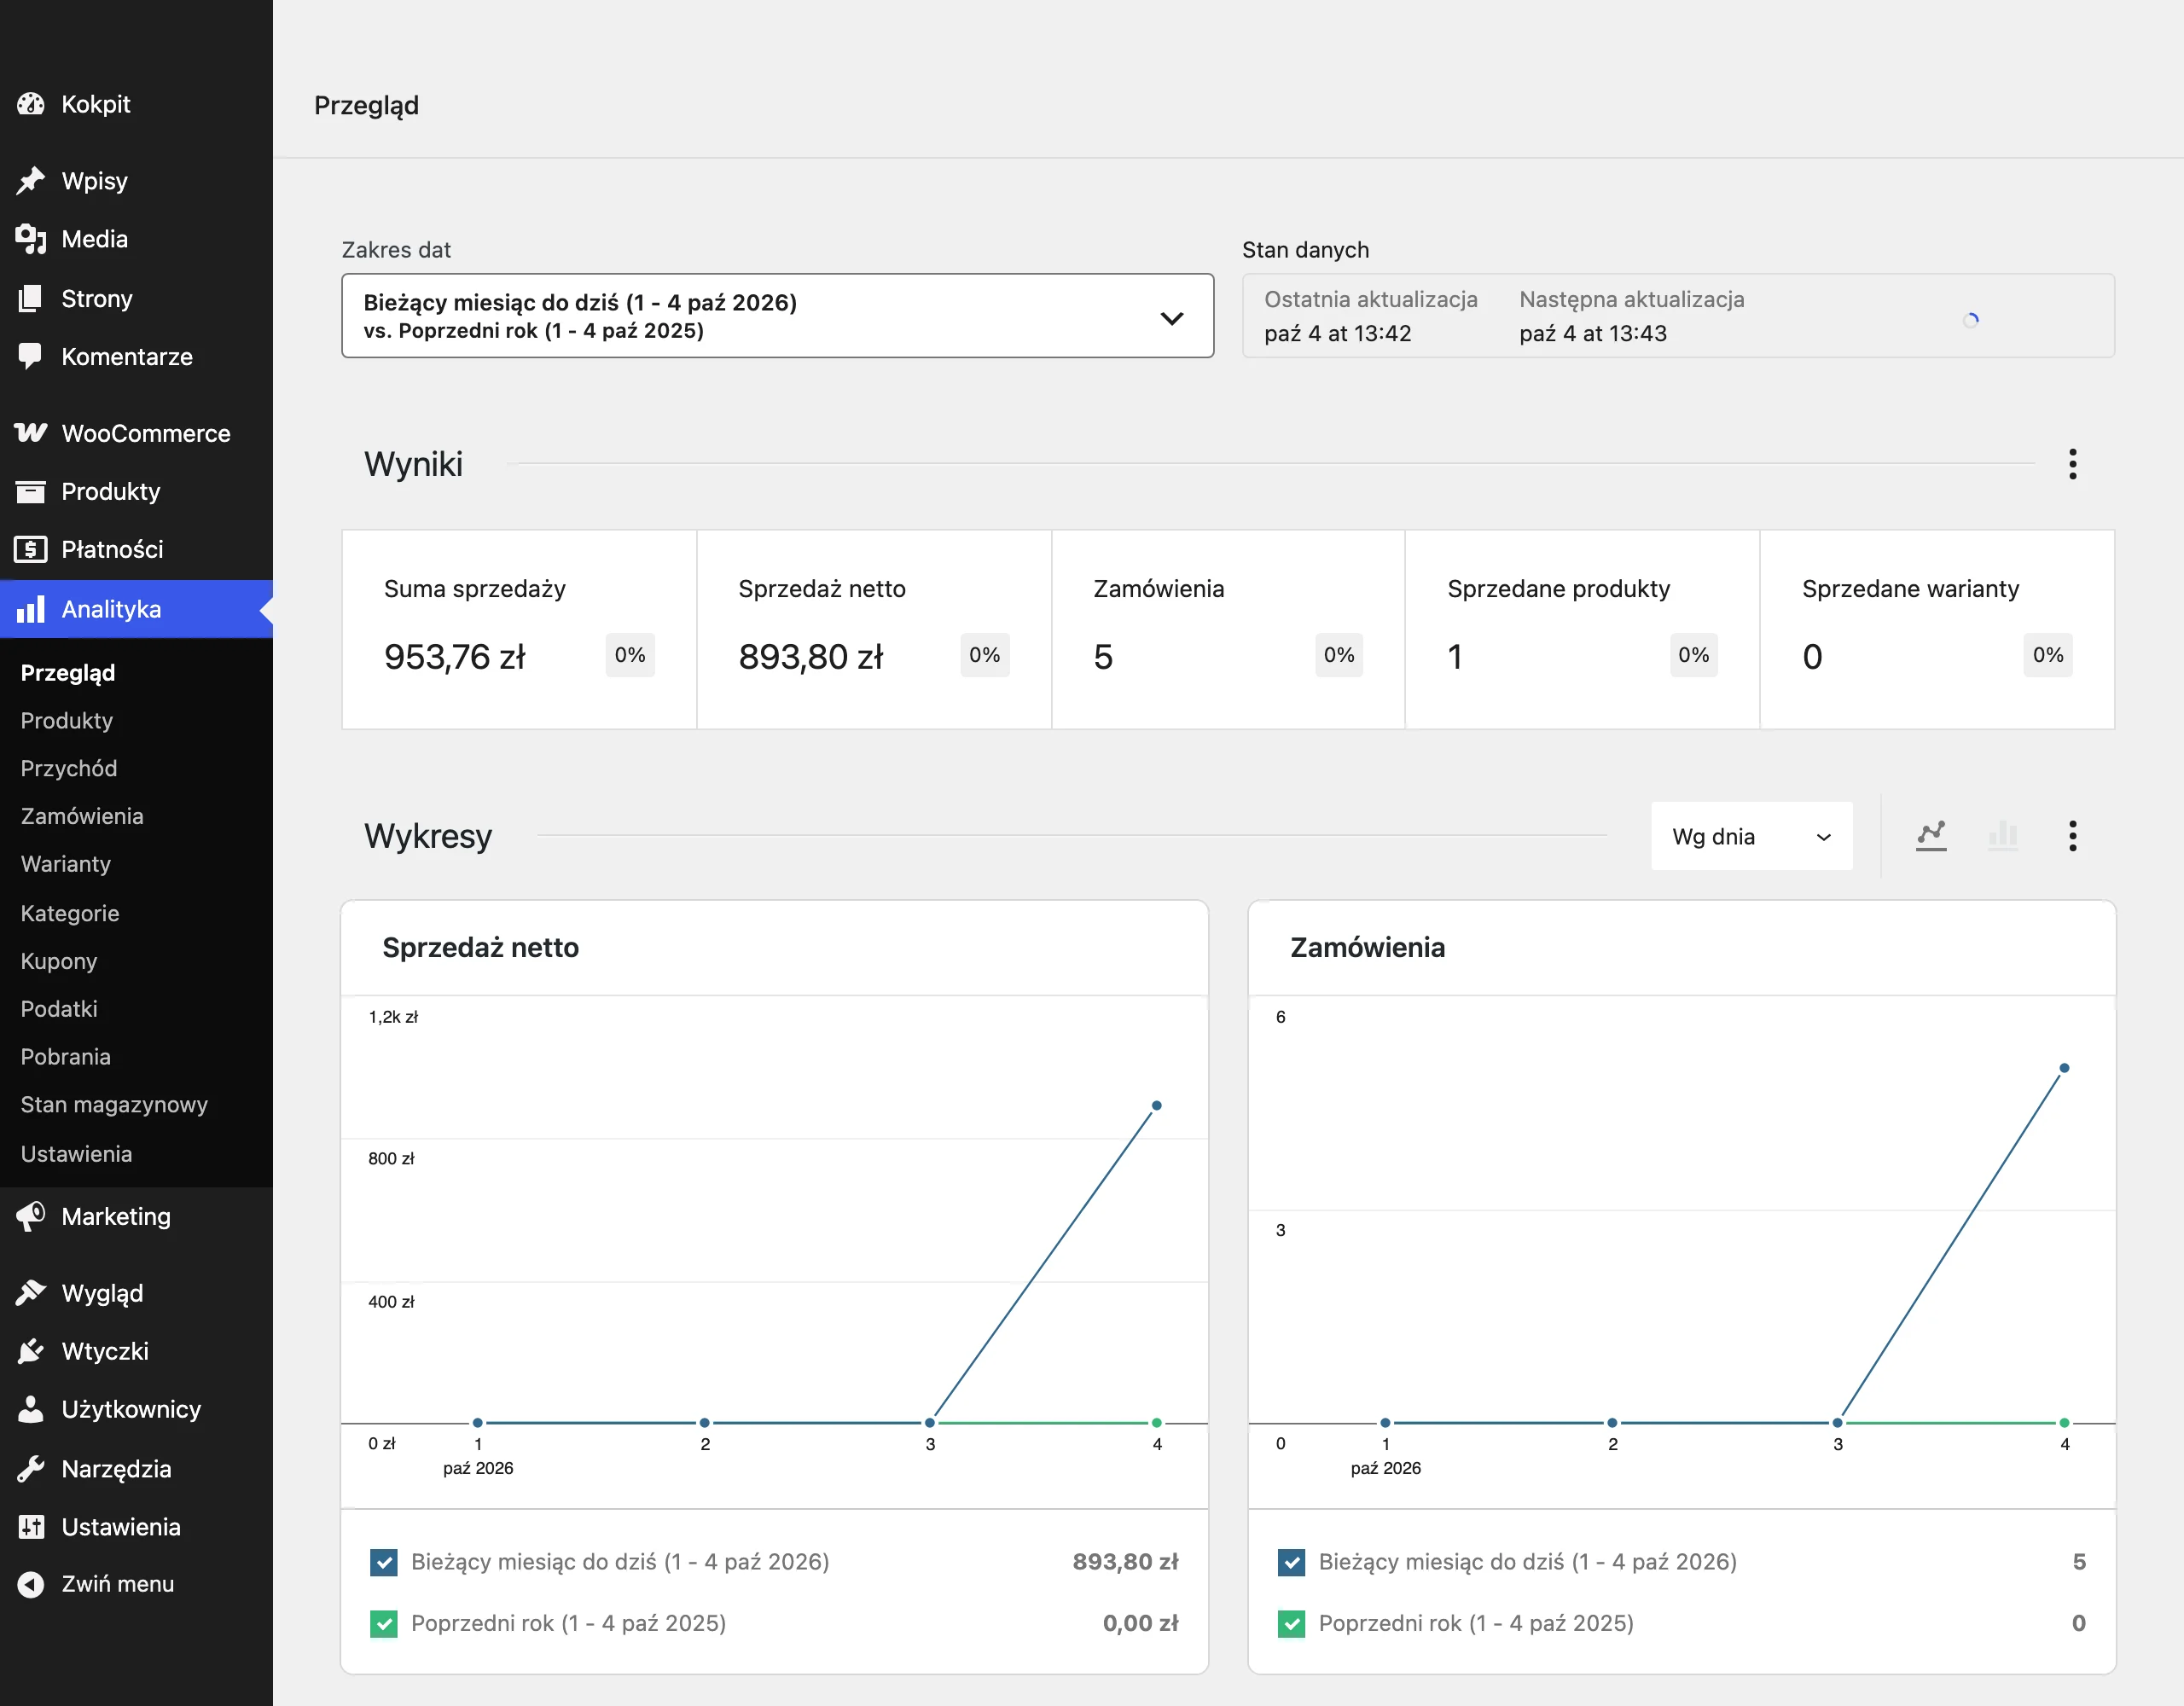
Defining revenue correctly is just as important, because “gross” can effectively mask the real return on marketing. For campaign optimisation, net revenue after discounts and returns, as well as margin, is usually the most useful, because ROAS calculated on gross can still look good even with high returns. To illustrate the scale of the error: with returns at 18%, ROAS based on gross can overstate the real result by around 22% (1/(1-0.18)). If your KPI do not take returns and discounts into account, your conclusions about channel performance will be systematically too optimistic.
KPI should include margin, because you can increase sales and still lose money when CAC grows faster than margin or discounts “eat” the profit. In practice, it is worth reporting gross margin after delivery and payment costs, as well as margin after marketing costs (Contribution Margin), because only then can you see whether growth is healthy. At the same time, build a funnel of Sessions → PDP view → Add to cart → Begin checkout → Purchase and measure drop-offs at each stage, so you clearly separate outcome metrics from controllable metrics. Segmentation (e.g. new vs returning vs VIP, acquisition channel, product categories, first-purchase cohorts at 30/90/180 days) protects you from misleading averages and makes it easier to interpret KPI changes accurately.
Data quality is a prerequisite, because faulty e-commerce events in GA4 can “shift” conclusions in the wrong direction. Check that totals match (purchase vs number of orders in the store), revenue discrepancies, duplicate transactions and missing item_id, and verify the implementation in GA4 DebugView and through tests in Tag Assistant. Also ensure consistency of identifiers (SKU/item_id) across the entire stack, because without that you will not be able to calculate margin and attribution at product level. When reporting, also allow for delays: the purchase decision often takes 3–14 days, and it makes sense to analyse results over a window of at least 7–28 days, rather than judging a campaign after 24 hours.
- 01Align data sourcesERP for finance, GA4 for analysis.
- 02Understand discrepanciesCancellations, returns, ad blockers.
- 03Define revenueRecommended net accounting revenue.
- 04Consistent reportingComparable and clear KPI.
Key: Treat GA4 as a behavioural analysis tool and the order system/ERP as the source of financial performance for consistent KPI.
How can North Star Metric help with e-commerce optimisation?
North Star Metric helps with e-commerce optimisation because it forces you to focus on one metric that brings together activities in marketing, UX and operations around value actually delivered. The NSM should not describe traffic alone, but a business outcome, e.g. “number of orders with margin > X” or “net revenue from returning customers”. For a store with frequent purchases, “orders/active customer/month” may be more sensible, while for more expensive products the overarching metric is more often “gross margin per order” and “LTV”. A well-chosen NSM limits optimisation “for attribution” and shifts attention to what genuinely supports profitable growth.
The NSM works best when you connect it with the funnel and controllable metrics that show what practically improves the result. Revenue is an outcome metric, but the levers include CTR, add to cart, checkout start or the rate of failed payments, which is why it is worth measuring drop-offs at the stages Sessions → PDP view → Add to cart → Begin checkout → Purchase. In practice, the NSM becomes a “compass”, and the funnel answers the question of where to intervene when the NSM falls. Segmentation (new/returning/VIP, channel, cohorts) additionally helps assess whether the NSM improvement comes from customer quality or merely a change in traffic mix.
NSM is also a way to structure reports and reduce disputes over numbers, provided you have established “one truth about the data” and consistent revenue definitions. If GA4 and the shop system show different revenues, report them in parallel: accounting revenue from the order/ERP system as the result, and GA4 as the layer for behaviour and campaigns. Where NSM is based on margin, mapping identifiers (user_id, order_id, item_id) and product data quality become crucial, because without this you cannot calculate profitability at order and SKU level. This means NSM stops being a “buzzword” and becomes a practical KPI that can be improved consistently in operational terms.
Differences in revenue between GA4 and the store system
Discrepancies in revenue between GA4 and the store system arise because GA4 is based on events and attribution models, while the store platform is based on financial transaction settlement. In practice, differences appear, among other things, due to cancellations, refunds, payment holds and the impact of ad blockers on measurement. As a result, the “same” period may look different in marketing reports than in the order system. If you want to make budget decisions without disputes over numbers, you must separate the metrics used for financial results from the metrics used to analyse behaviour and campaigns.
The most useful approach is to report two perspectives explicitly: “accounting” revenue from the order/ERP system and revenue in GA4 as the analytical layer for channels and user behaviour. To understand where the differences come from, verify that totals match (the number of “purchase” events vs the number of orders), catch duplicate transactions and missing item_id values, and check the implementation in GA4 DebugView and Tag Assistant. In payments, it is also worth distinguishing “purchase” from a payment completed successfully and relying on the order status in the store/PSP (e.g. PayU, Przelewy24, Stripe), because this shows real declines and unpaid orders. Consistent mapping of identifiers (order_id, item_id/SKU) across the whole stack is the condition for calculating these gaps, not just “explaining” them.
- 01GA4: Modelling and eventsAttribution, estimates, intent
- 02Store: transaction settlementFinance, real payments, facts
- 03Discrepancies in numbersRefunds, cancellations, ad blockers
- 04Separate perspectivesAnalysis vs financial result
- 05Budget decisionsUnderstanding both sources
The key to effective decisions is explicit reporting of two perspectives: accounting revenue from the order system and analytical revenue from GA4.
Customer segmentation strategies: new vs returning vs VIP
Segmentation into new, returning and VIP customers is crucial, because averaged results can mask completely different behaviours and the profitability of individual groups. New customers usually have a lower conversion rate and lower AOV than returning customers, while VIPs can generate a significant share of margin. Without segmenting, it is easy to wrongly attribute a change in CR or revenue to “better UX”, when in fact the traffic mix or the share of remarketing has changed. The simplest benefit of segmentation is a quick answer to the question: are campaigns building the base (new), or merely closing existing customers (returning/VIP).
In practice, segment at least by customer source and purchase context so that the KPI can be compared over time and across channels. It is especially worth keeping a consistent segment standard and reporting them in parallel, because only then can you see whether, for example, a drop in effectiveness results from acquisition quality or from a funnel issue. A good дополнение is cohort segmentation by first purchase date (e.g. the last 30/90/180 days), which allows you to compare the quality of customers acquired in different periods. If you do not separate results by segment, you risk optimising for a “nice” overall result that does not scale in terms of margin.
- customer type: new / returning / VIP
- acquisition channel (by source and campaign)
- product categories
- first purchase cohorts (e.g. 30/90/180 days)
Marketing effectiveness: CAC and its impact on budget
CAC shows directly how much it costs to acquire a new customer, which is why it is one of the key metrics when planning a marketing budget. Calculate it as (marketing costs + sales costs) / number of new customers in the same period, rather than as the cost per order. In stores with a large number of repeat purchases, CAC calculated “per order” will be understated, making it easy to overestimate the scalability of campaigns. If CAC is not calculated on new customers, budget decisions can be based on seemingly cheap sales that do not, in practice, build the customer base.
You should treat CAC as a financial-operational KPI, while advertising metrics serve as the diagnostics that explain its fluctuations. When CPC rises (e.g. by 30%) with a stable conversion rate, CAC will also go up, so to maintain efficiency you need to improve the creative or the landing page. Conversely, if CTR/CPC/CPM deteriorate, this may signal a problem with message fit and targeting before you even see it in acquisition cost. This means the budget is not “tightened” blindly, but is based on the specific cause of the CAC increase.
- 01Customer acquisition cost (CAC)A key budget metric.
- 02Calculation formula(Marketing + Sales) / New Customers.
- 03Error: on orderAvoid it, it underestimates the actual costs.
- 04Financial-operational KPIBuilds a real customer base.
CAC is the foundation of strategic budget decisions, not just an advertising metric.
ROAS vs MER: which metric measures campaign effectiveness better?
MER usually better reflects campaign effectiveness from a business perspective, because it is less susceptible to attribution manipulation than ROAS. ROAS depends on the platform’s attribution model, whereas MER = revenue (preferably net) / total marketing spend shows the overall result. For example, MER 6 means that 1 zł of spend generates 6 zł of revenue. If MER falls month on month, it most often means higher reach costs or lower conversion, not a “reporting problem”.
ROAS is still useful operationally, but it requires careful interpretation, because it “looks” exactly as the attribution in a given platform suggests. MER, on the other hand, makes it possible to compare periods and channels in a way that is more resilient to changes in settings, attribution windows or differences in reporting. In practice, the clearest approach is to use both metrics in parallel: ROAS to assess and optimise at platform level, and MER as a check that the total marketing spend is delivering results at company level. This makes it clear whether an improvement in the ad dashboard is translating into the real effectiveness of the whole marketing activity.
Retention and customer loyalty in the context of LTV
Retention and loyalty are crucial in the context of LTV, because they determine whether customer acquisition cost (CAC) has a chance to pay back in margin over the following months. It is worth calculating LTV as margin (not revenue) over a 6/12/24-month horizon, because only then do you get a useful cap for the maximum CAC. If you do not have full data, a practical proxy is LTV_180, i.e. average margin over 180 days from the first purchase, updated weekly or monthly. When LTV is calculated “on margin”, the budget conversation stops being a debate about ROAS and becomes a decision about the actual profitability of acquisition.
Retention is best measured through Repeat Purchase Rate (e.g. the share of customers with a repeat purchase within 30/60/90 days) and cohort analysis by month of first purchase, because averages can hide a decline in the quality of new customers. Cohorts show whether, for example, customers acquired in a given month “reach” subsequent purchases and margin at a similar pace as earlier groups. A good supplement is payback period, i.e. the time after which cumulative margin covers CAC. Its extension (e.g. from 30 to 90 days) usually signals a problem with discounts, ad costs or lower purchase frequency. As a result, retention becomes a measurable element of cashflow planning rather than just a “nice extra”.
Loyalty operationally organises RFM (Recency, Frequency, Monetary), because it helps identify VIPs, dormant customers and new customers with high potential, and also measure the impact of campaigns on repeat purchases. Churn should be defined according to the category (e.g. no purchase for 120 days in cosmetics or 365 days in furniture) and the share of reactivation after winback campaigns should be tracked, rather than guessing “who will come back”. In CRM channels (email/SMS/push), monitor revenue per recipient and deliverability (bounce, spam complaint, unsubscribe), because the quality of sends directly affects future retention revenue. Assess a loyalty programme through incremental revenue vs the cost of points, comparing participants to a matched control group (by RFM), so that you do not confuse “attribution” with incrementality.
Conversion metrics and their importance for CRO strategy
Conversion metrics are crucial for CRO strategy, because they show which elements of the user experience actually increase the number of purchases or revenue per session. Calculate the conversion rate (CR) consistently as orders/sessions (or users) and keep it in a fixed standard split by device (mobile/desktop), because otherwise it is easy to draw misleading conclusions. When assessing changes on a site, a better KPI than CR alone is often “revenue per session” or “margin per session”, because it combines the impact of CR and AOV and takes account of trade-offs in upsell. This means CRO optimisation does not come down to “more transactions”, but to improving the economics of each visit.
In practice, CRO is based on diagnostic metrics that show where users lose purchase intent, e.g. Add-to-Cart Rate (add_to_cart / PDP views) and a set of key interactions on the PDP. It is worth counting clicks on the size chart, variant selection, image enlargement, opening reviews or clicking “delivery and returns”, because these behaviours often precede a transaction. If 40–60% of people check sizes and still do not buy, the cause is often an unclear fit guide or a lack of model photos. In stores with a broad assortment, search and filtering are an additional lever: compare session CR with search vs without, because users who use search can convert 2–4x better, and errors in results are effectively lost sales. When you do not measure “along the way” metrics (PDP, cart, checkout), CRO turns into guesswork about which changes actually lift the result.
Conversion is also clearly influenced by “non-technical” factors from the user’s perspective, but ones that can be captured in data, such as page speed (LCP/INP/CLS) and trust. In the area of trust metrics, it is worth monitoring clicks on the returns policy, FAQ, payment methods, certificates and reviews, because shifts in these indicators with a stable CR may mean better visibility of information or friction in the decision-making process. In A/B tests, set “revenue per session” or “margin per session” as the primary metric, define the minimum detectable effect (MDE) and test duration in advance (e.g. 2–4 weeks), and avoid ending the test after 2–3 days, because then the results are largely random. When a purchase happens rarely (e.g. more expensive products), observe micro-conversions such as clicking “contact”, downloading a PDF with the specification, adding to a comparison tool, signing up to the newsletter on the PDP or starting the configurator, so that you can improve UX and campaigns before you collect a statistically significant number of transactions.
FAQ
Frequently asked questions
Which metrics really matter in e-commerce analytics?
The most important are those that show business value: net revenue, margin, CAC, MER, LTV, retention and conversion. Traffic alone or “nice” charts are not enough to assess whether a store is profitable.
Why does revenue in GA4 differ from revenue in the store system?
GA4 and the store system measure different things: GA4 works on the logic of events and attribution, while the store is based on financial transactions. Differences can result from returns, cancellations, payment holds and ad blockers, among other things.
Is ROAS enough to assess the effectiveness of e-commerce campaigns?
No, because ROAS can look good even when returns are high or margin is low. In the article, MER, net revenue and margin are indicated as more business-focused metrics.
How should CAC be calculated in an online store to make the result reliable?
CAC should be calculated as marketing and sales costs divided by the number of new customers in a given period. Calculating it on orders rather than new customers can artificially understate the result.
When is it worth using a North Star Metric in e-commerce?
When you want to align marketing, UX and operations around one metric that reflects the business outcome, not just traffic. Metrics such as the number of orders with margin above a certain level or net revenue from returning customers work well.
How does customer segmentation help analyse KPI in e-commerce more effectively?
Splitting results into new, returning and VIP customers shows where the change in conversion, revenue or margin really comes from. Average data can hide a change in traffic mix or a decline in acquisition quality.