

Performance marketing can only be assessed properly once you have precisely defined the business goal and translated it into the right KPI. In practice, many campaigns “look good” in clicks, yet do not deliver sales, because reporting covers only the top of the funnel. This section shows how to select metrics for e-commerce sales and lead generation, and how to set KPI at the TOFU/MOFU/BOFU stages. You will also find guidance on when to use micro-conversions to optimise activity faster, and when to evaluate results solely on the final conversion. As a result, it becomes easier to spot at which stage the result is “leaking” and what genuinely improves efficiency.
How to effectively map business goals to campaign KPI?
Effectively mapping a business goal to KPI starts with answering whether the priority is “sales here and now”, or rather growing the customer base first, and only then selecting campaign metrics. In e-commerce, KPI most often relate to revenue and margin, whereas in lead generation the key measures are CPL (cost per lead) and CAC (customer acquisition cost), calculated with the lead-to-sale journey taken into account. This distinction immediately brings order to results interpretation, because a “cheap lead” does not always translate into real revenue growth. When the goal is defined unambiguously, it is also easier to maintain a consistent reporting standard across the whole team.
The conversion should reflect real business value (e.g. “purchase” or “signed contract”), and micro-conversions should support shorter optimisation cycles. If there are few purchases (e.g. around 20 a day), the campaign can be optimised for “add_to_cart”, while effectiveness is assessed on “purchase”. This approach shortens the learning phase and allows you to react to earlier signals without losing sight of the final goal. At the same time, it reduces the risk of a situation where a campaign “wins” on intermediate events but loses in business terms.
A good KPI also requires setting profitability thresholds, because the question “what CPA is good?” only makes sense in the context of margin and LTV, not internet benchmarks. For example, if the average gross margin per order is 80 zł and you allocate fixed costs of 20 zł, the maximum ad cost per purchase can be around 60 zł. In practice, the same ROAS may mean something different depending on the product and margin level, which is why it is worth breaking results down at least by product categories, channels (Search/Shopping/Social/Affiliate), and new versus returning customers. Such segmentation reduces budget “burn” on easy closes via retargeting and makes scaling decisions easier.
Sales funnel optimisation: key metrics at each stage
Sales funnel optimisation makes sense when you track separate metrics for TOFU/MOFU/BOFU, instead of limiting yourself to clicks or traffic volume alone. The common scenario of “high clicks, no sales” comes from the fact that reporting covers only the top of the funnel and does not show where the result is actually “leaking”. That is why KPI should be assigned to each stage of the process, so that diagnosis is quick and unambiguous. In practice, this makes it easier to distinguish whether the problem lies in the creative, the quality of the traffic acquired, or the effectiveness of closing on the site.
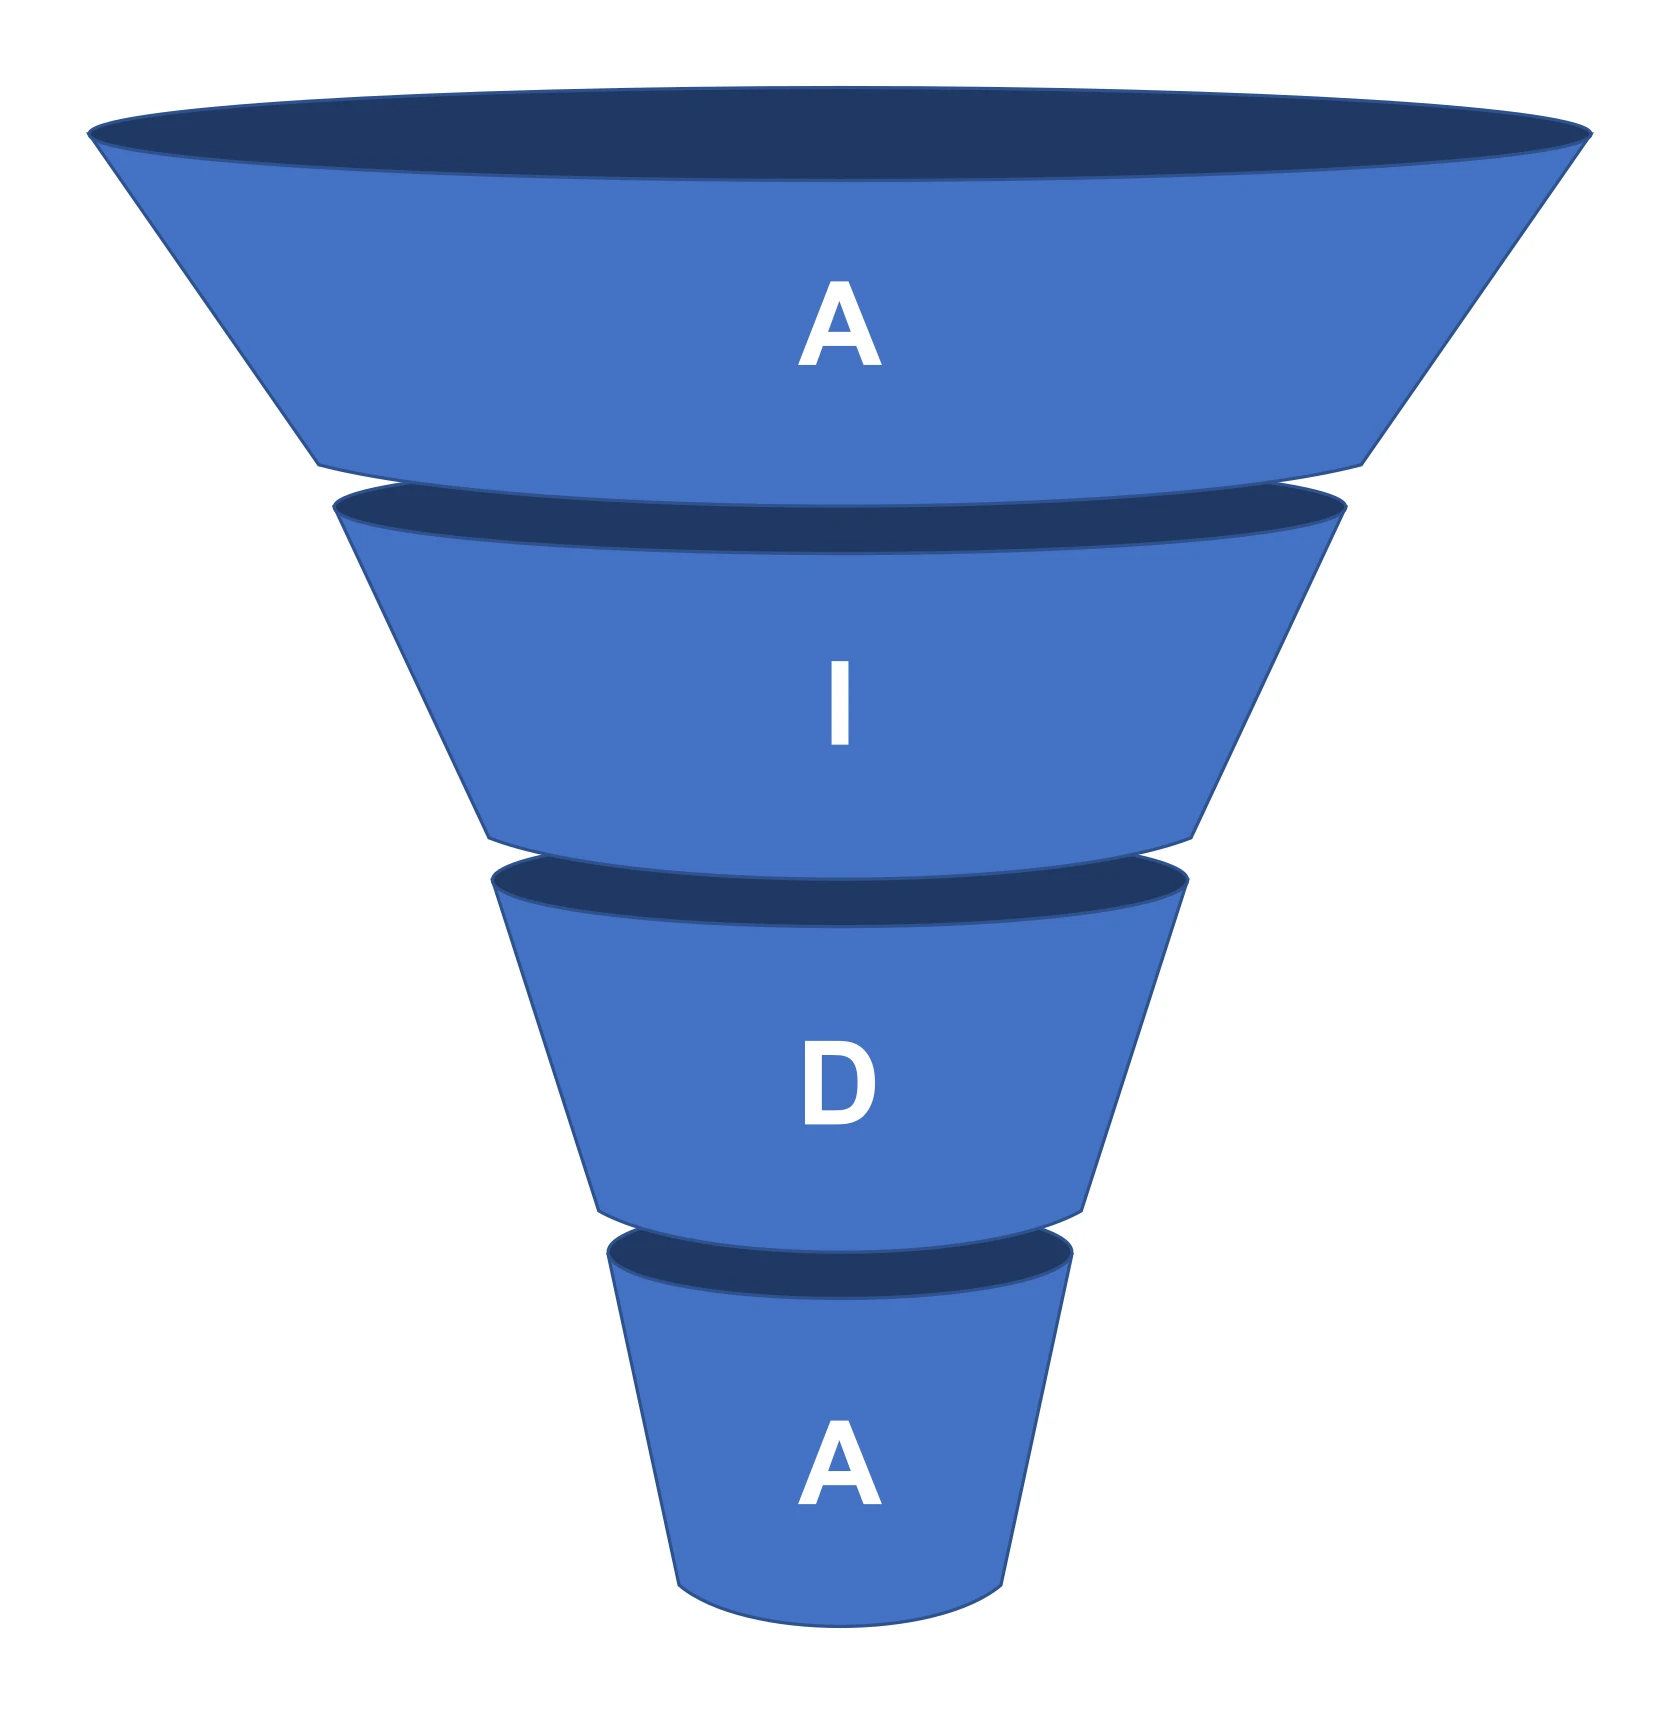
- TOFU: reach and CPM (whether you are reaching the right scale and cost per reach).
- MOFU: CTR and CPC (whether the message and offer generate quality visits).
- BOFU: CPA/ROAS and conversion rate (whether traffic turns into a business result).
The key to stable results is consistent KPI across the whole journey: from reach and CPM, through CTR/CPC, all the way to CPA/ROAS and conversion rate. This structure makes it possible to assess whether the bottleneck is the cost of reach, a drop in engagement, or the closing stage (e.g. a lower CVR). At the same time, you maintain a clear division: top- and middle-funnel metrics serve diagnosis and optimisation, while bottom-funnel metrics are used to assess campaign effectiveness. This means budget decisions are based on where you are actually losing results, rather than on a single “overall” metric.
Implementation and tracking management: tools and strategies
Effective tracking implementation in performance marketing consists of combining behavioural analytics (GA4) with cost data and conversions from ad platforms. GA4 measures traffic and on-site conversions well, but it does not replace cost data or in-platform reports, which is why it is worth bringing them together in one reporting environment. In practice, this means integrating GA4 with Google Ads and Search Console, and importing costs from channels such as Meta/TikTok via connectors (e.g. Supermetrics) or your own ETL. This allows you to calculate ROAS/CAC on a shared data definition, instead of comparing “inconsistent worlds”.
Organising tags usually starts with Google Tag Manager and clearly described rules for events. Event duplication most often results from tags firing multiple times or without conditions, so it is worth implementing a naming standard (e.g. purchase, generate_lead, add_to_cart) and constraints such as “once per page”. It is a good idea to test implementations in Preview/Debug in GTM and in GA4 DebugView, so you can quickly catch errors before they reach reports. This shortens the time needed for diagnosis when the results “suddenly go out of alignment”.
In e-commerce, the most reliable tracking should be built on the basis of the dataLayer with a full set of attributes (e.g. product ID, price, discount, coupon, quantity), rather than “scraping” information from the DOM. For the purchase event, it is crucial to send, among other things, transaction_id, value, currency and items[], because without these elements it is harder to assess the effectiveness of categories and make adjustments (e.g. returns) in the data. Equally important is a consistent definition of conversion across systems: “Zakup” in Google Ads should correspond to purchase in GA4 (or an imported conversion), and in Meta it is worth comparing results with AEM/event priority settings and after implementing Conversions API. This reduces the risk that the same campaign “sells” in one tool, but not in another.
- Set one billing currency and one time zone (e.g. Europe/Warsaw), so that daily reports do not “float”.
- Import costs into one place (BI), because without costs you cannot calculate ROI/ROAS/CAC in a comparable way across channels.
- In lead gen, send offline conversions from CRM (e.g. HubSpot, Pipedrive, Salesforce) with MQL/SQL/Won stages and values, so that optimisation relates to real revenue rather than “cheap forms”.
- Validate data by comparing sources: differences in transactions between GA4 and the store system (e.g. Shopify, WooCommerce) >5–10% should be treated as an alert, and you should look for the cause in logs or in tools such as Tag Assistant/Omnibug.
Recovering data quality increasingly requires a server-side approach. When accuracy drops due to ad blockers and browser restrictions, implementing sGTM (e.g. on Google Cloud Run) and Conversions API/Enhanced Conversions can improve attribution by a few to several percent, but it requires ensuring deduplication (event_id). It is also worth treating validation as an ongoing process: tests, source comparisons and monitoring of events that disappear or are duplicated. This means budget decisions are based on stable data, not “measurement noise”.
Analysis of effectiveness: ROAS, ROI and their practical application
Analysis of effectiveness in performance activities should start by distinguishing whether you are calculating ROAS (revenue/cost) or ROI, which takes real profitability into account. ROAS answers the question “does the campaign sell”, but it does not determine whether you are making money from it, especially when margins differ significantly between products. ROI should take margin, fulfilment costs and fixed costs into account, which is why in practice Contribution Margin ROI is often calculated: (margin − advertising cost)/advertising cost. This perspective more quickly shows which campaigns build business results and which only generate turnover.
If possible, calculate “profit ROAS” (profit/spend) or at least weight ROAS by margin at SKU or category level, because ROAS calculated solely from revenue can be misleading. This is especially important when comparing campaigns with a different product mix or when promotions eat into margin, even though the number of orders is rising. It is also worth taking returns and cancellations into account by calculating ROAS on net revenue, because “how much we sold” does not always mean “how much was left”. In practice, categories with a high return rate need a higher minimum ROAS than those with few returns.
ROAS and ROI do not replace cost metrics such as CPL/CPA, but these indicators need to be read through the prism of quality. Low CPL can be deceptive if leads do not convert into sales, so measure CPL together with lead→SQL CR and the target CAC per customer. In subscription models or with repeat purchases, payback period also comes into play, i.e. the time it takes to recover the acquisition cost. With a margin of 50 zł/month and CAC of 300 zł, payback is approx. 6 months, so it is difficult to assess a campaign reliably after 7 days. This approach clarifies expectations and protects against switching off activities that pay back with a delay.
In budget management practice, effectiveness analysis should also take into account value over time, i.e. LTV and the LTV:CAC ratio. If retention and upsell “deliver” the result after 60–180 days, a weaker ROAS on the first purchase can be accepted, provided that the target LTV:CAC remains within assumptions (e.g. 3:1, depending on the industry). At the same time, control AOV and the impact of promotions, because an increase in orders with a falling AOV may mean giving away margin through overly aggressive discounts. This means you calculate effectiveness not only “here and now”, but in a way that is consistent with the unit economics of the business.
Attribution models: how to correctly assign campaign results?
Correctly assigning campaign results requires choosing one coherent approach to attribution and applying it consistently in management reports. Differences between last-click, data-driven and view-through are one of the main reasons why Meta can report more sales than GA4, because each tool counts conversions in a different model and window. Decide in advance whether you report conservatively (last-click) or rely on data-based models (e.g. data-driven in Google Ads), and whether you include view-through. This way, you avoid a situation where the result “changes” solely because the calculation method changed.
Match the attribution window (e.g. 1/7/28 days) to the decision-making cycle and communicate it clearly, because changing the window alone can reduce the number of conversions by several to several dozen per cent in discovery channels. In simple e-commerce, 7 days after click is usually assumed, whereas in B2B the evaluation horizon is often derived from CRM data (even 30–90 days), while maintaining a shorter window for optimisation. In practice, this comes down to tracking “fast” results in parallel (for operational decisions) and “full” results (to assess impact over a longer period). This setup limits rash budget cuts when conversions naturally take time.
Conversion paths and assisted conversion analysis make it easier to assign a role to channels that rarely close sales in a last-click model. In GA4 it is worth exploring conversion paths and comparing a channel’s share of the first touch with its share of the close, because display/video often “appears” in assists despite low last-click ROAS. At the same time, make sure your UTM tags are consistent (utm_source, utm_medium, utm_campaign, utm_content) and that campaign identifiers are in place, so you can clearly show which creative and which traffic source are actually driving results. Without consistent tagging, attribution conclusions will be random, even with solid cost data.
Pixel data and Conversions API require constant verification so that attribution is not artificially inflated by duplicates. After implementing CAPI, a common sign of a problem is “2× more purchases”, so deduplicate events by event_id and check in Meta Events Manager whether the number of “deduplicated” events is increasing. In reports, use a simple rule: treat ad platforms as tools for optimisation (in-platform CPA/ROAS), and GA4/BI as the benchmark for cross-channel comparisons and budget decisions. With cookie limitations and cross-device behaviour, assess aggregated trends rather than expecting full 1:1 consistency, support yourself with User-ID (for logged-in users) and solutions such as Consent Mode v2.
Problem diagnosis and traffic quality analysis
Diagnosing problems in performance marketing comes down to quickly establishing whether the traffic intent, lead quality, landing page, or the measurement itself is deteriorating. In Google Ads (Search/Shopping), start with the search terms and match types reports, because a rise in cost without sales often results from poor intent matching. Add exclusions (negative keywords) and split brand vs non-brand campaigns, as brand can artificially inflate ROAS and mask weaker activities. This split also makes it easier to assess whether the problem lies in demand generation or only in “capturing” it on branded keywords.
In lead generation, you will only get a reliable assessment of traffic quality once you measure lead quality, not just the number of submitted forms. In practice, this means checking the data (e.g. business email vs personal) and scoring in the CRM (e.g. 0–100), then reporting the cost per scoring point or the cost per SQL. This approach quickly reveals which campaigns deliver contacts that are genuinely “ready for sales”, and which only provide cheap volume. That way, you avoid falling into the trap of optimising for CPL, which does not necessarily translate into real sales.
An unnaturally high CTR with zero conversions may signal fraud or bot traffic, especially in display campaigns. In such a case, it is worth implementing solutions such as Cloudflare Bot Management and form protections (reCAPTCHA/Turnstile), and in the analysis excluding domains/apps and considering whitelists in programmatic. At the same time, make sure the cause does not lie with the landing page and checkout: monitor Core Web Vitals and errors, because for example an LCP > 4 s on mobile can reduce CVR, and mounting 500 errors will burn through budget with no chance of return. This helps separate traffic quality issues from infrastructure or UX issues.
When traffic is coming in but conversions are still missing, quality tools let you see where users are getting stuck. Hotjar and Microsoft Clarity can show, for example, rage clicks on cart elements or repeated stumbling points in the journey, and an on-site survey makes it possible to collect reasons for abandonment (e.g. “delivery cost is too high”). In the next step, check cohorts and retention after 30/60/90 days, because channels can differ in value over time (e.g. Social weaker in 7 days, but better in 90). This shifts the assessment from “the campaign does not work” to “the campaign works on a different horizon”.
If social media results are worsening despite a similar budget, check frequency and Audience Overlap, because these factors can push CPM up and damage efficiency without any change in the offer. In practice, it helps to set exclusions (e.g. buyers in the last 30 days) and limit retargeting when frequency grows faster than conversions. At the business level, add margin per channel and operational costs to the analysis (e.g. fulfilment, commissions, customer service, chargebacks), because “good metrics” do not always translate into a tangible increase in profit. Finally, account for seasonality and external factors by comparing WoW and YoY and recording events such as promotions, price increases or stock shortages, so you do not optimise “blindly”.
Tests and experiments: how to measure campaign incrementality?
You talk about campaign incrementality when you compare ad-supported sales with the counterfactual scenario of “what would have happened without it”, rather than relying solely on attribution reports. In practice, this comes down to designing experiments that separate the impact of marketing activities from demand that “would have happened anyway”. To quickly improve operational efficiency, A/B tests on landing pages and in the checkout are most often used, comparing differences in CVR and revenue per user. At the same time, in social media you usually get to better results faster through creative and message testing than through painstaking micro-optimisation of targeting.
The most rigorous method of verifying impact is holdout (e.g. geo split), that is, switching off campaigns in 10–20% of regions for 2–4 weeks and comparing sales lift adjusted for seasonality. This kind of test directly answers the question of whether advertising really “adds” conversions, or merely captures them in the reports. In a similar approach, it is worth checking brand search by restricting delivery on selected days or in selected regions and observing the drop in sales and shifts in organic/Direct. The result shows whether brand ads generate incrementality, or largely monetise demand that would have closed anyway.
In the Meta ecosystem, Conversion Lift tests can be useful, as they can indicate additional conversions above the baseline, but they require sufficient scale. With smaller budgets, such an experiment may not produce clear conclusions, so it is crucial to plan the minimum volume and duration, and to interpret the results through the lens of iCPA (incremental cost per acquisition). When the channel mix is broader (offline/online), MMM is used for budget planning, as it estimates the impact of channels on sales based on weekly data and spend, but it needs a longer history (e.g. 1–2 years). This means budget allocation decisions are based on real impact, rather than attribution alone.
Reliable conclusions from experiments require a minimum sample size and a pre-defined MDE, because with small changes (e.g. +3% CVR) you usually need thousands of sessions per variant. Just as important is testing offer elements such as promotion thresholds and pricing policy (e.g. free delivery thresholds or voucher value), with evaluation based on profit per session rather than CVR alone. To make sure the organisation actually learns from tests, keep an experiment log (hypothesis, change, segment, result, decision), because without documentation it is easy to keep returning to the same attempts and wasting time. Such a knowledge base speeds up future iterations and makes it easier to justify decisions with data.
Strategic reporting and dashboards: how to make budget decisions?
You make budget decisions most efficiently when the whole team works from one shared BI reference point and the same KPI definitions. A dashboard in Looker Studio or Power BI should combine data from GA4, advertising platforms (e.g. Google Ads, Meta) and CRM, so that costs and results are visible in one place. This cuts short debates along the lines of “who is right” and shortens the path from spotting a problem to taking concrete action. In addition, one calendar and standardised metrics make it easier to compare channels over the same time horizon.
It is worth reporting in two cadences: weekly for optimisation and monthly for assessing business goals. On a weekly basis, you answer operational questions: what is growing/falling, where to shift budget, and which tests to launch. Monthly, you report business metrics such as CAC, margin, share of new customers and returns, as well as strategic insights regarding channels that can be scaled. This way, you do not mix short-term diagnostics with assessing long-term profitability.
Monitoring and alerts are essential, because they let you catch a day-on-day conversion drop of >20%, a CPA increase of >30%, or a sudden fall in the number of purchase events before the budget starts to “burn”. At the same time, build views by segment (device, region, new/returning), because “overall” results often mask the source of the problem. Segmentation can quickly show that the issue affects, for example, only mobile in one region, which speeds up the fix and limits losses. It is also a practical answer to the question “what exactly broke and where?”.
Budget control requires pacing, that is, monitoring the rate of spend by comparing spend and results against the daily/weekly plan, so you know whether you will “deliver” the target by the end of the month. When campaigns spend too quickly (e.g. 60% of the budget in 10 days), you introduce limits or change the bidding strategy, rather than reacting only after the fact. Also set decision rules: when to scale (e.g. net ROAS above the target by 20% for 7 days and conversion volume >50), and when to cut (e.g. ROAS below the threshold for 10 days despite creative iterations). Such thresholds reduce emotion-driven decisions and organise communication within the team.
Scaling should take saturation and diminishing returns from budget into account, because a 2× higher spend rarely translates into 2× higher sales when CPMs are rising and auction quality is changing. In practice, monitor marginal ROAS (mROAS) and increase budget in steps (e.g. +15–25% every 3–5 days), rather than doubling it overnight. To make roll-outs repeatable, turn insights from reports into tasks in tools such as Jira/Asana, and after implementation compare the effect period over period. Finally, regularly audit your reports, version changes and make sure KPI definitions do not “drift”, otherwise the results will stop being comparable from month to month.
FAQ
Frequently asked questions
How should you choose KPIs for the business goal in performance marketing?
First, you need to determine whether the goal is immediate sales or building a customer base. Only then do you choose the metrics: in e-commerce, most often revenue and margin, and in lead generation, CPL and CAC.
Does a low number of clicks mean a weak campaign?
Not necessarily, because a campaign may look good in clicks but fail to deliver sales. If reporting covers only the top of the funnel, it is easy to miss the point where the result really “drops off”.
When is it worth optimising a campaign for micro-conversions?
When there are too few purchases to quickly gather signals for optimisation, you can base it on micro-conversions, e.g. add_to_cart. However, it is still worth measuring effectiveness against the final conversion, e.g. purchase.
Which metrics should you track at the TOFU, MOFU and BOFU stages?
At TOFU, look at reach and CPM, at MOFU at CTR and CPC, and at BOFU at CPA, ROAS and the conversion rate. This split helps you determine whether the problem lies in reach, engagement or closing the sale.
Is ROAS enough to assess a campaign’s profitability?
No, because ROAS shows whether a campaign is driving sales, but not always whether you are making money from it. To assess profitability, you need to take margin, fulfilment costs, fixed costs, as well as returns and cancellations into account.
How should you correctly attribute campaign results across tools?
You need to adopt one consistent attribution approach and apply it consistently in reports. Differences between last-click, data-driven and view-through mean that the same source may look different in GA4, Google Ads and Meta.