
Direct Traffic in Google Analytics at first glance seems simple, yet in practice it can be one of the most misleading channels. An increase in this kind of traffic may indicate growing brand awareness, but just as often it results from imperfections in measurement. The same applies to declines, which do not always signal a problem on the business side. The most important thing is to distinguish genuine direct visits from visits that the system simply could not attribute to a source correctly. This text is precisely about that boundary and how to verify it in practice. This makes it easier to assess whether Direct is really growing, or whether you are losing information about the other channels.
What is Direct Traffic in practice?
Direct Traffic reaches Google Analytics when the system has no reliable data about the visit source or the referrer. The most intuitive case is when a user types the website address manually or comes from a saved bookmark. In reports, however, this same channel also includes some visits that were not “direct” in the everyday sense at all. That is why a high share of Direct alone does not yet determine where users actually came from.
True Direct most often concerns visits to the homepage, short and easy-to-remember addresses, or subpages regularly visited by returning customers. Such a scenario is consistent, because the user knows the brand or comes back to a previously saved site. However, if a large share of Direct appears on long, complex URL addresses, it is usually not natural user behaviour. In that situation it is more often about losing source information than about genuine direct traffic.
Artificial Direct appears when a user arrives from a specific channel, but that information does not reach analytics. This is common with links in emails, messengers, SMS messages, PDF files, QR codes, some mobile apps, or incorrectly configured redirects. When such visits are not tagged with UTMs, or the parameters are technically lost along the way, Google Analytics assigns the session to Direct. In the report it looks like direct traffic, although from a business perspective it is the effect of a campaign or another source.
Direct should therefore be treated not only as a marketing channel, but also as a diagnostic indicator. In practice, growth in this channel may mean greater brand awareness, more returning users and better results from branding activities. But it can equally well signal that email, social, referral or paid has stopped being measured properly. The most common mistake is to treat Direct as a clean indicator of loyalty or brand strength without checking the quality of attribution.
- 01Manual entry and bookmarksThe user knows the site address or uses a saved one.
- 02No source dataThe GA system does not know the referrer or visit source.
- 03Known and short addressesOften the homepage, easy addresses or regular returns.
Key takeaway: A high share of Direct does not always mean direct visits, but often a lack of complete data about the real source of traffic.
Current context of measuring Direct Traffic
At present, measuring Direct Traffic works in such a way that in GA4 the result for this channel depends on which report you use, which dimension you choose and how good the implementation is. This matters, because Direct looks different in session-based analysis and different in user-based analysis. In practice, the reports most often used for diagnosis are Traffic acquisition, Landing page, Source/Medium and Default channel group. Only comparing these views allows you to assess whether you are observing real user behaviour, or rather a problem with source attribution.
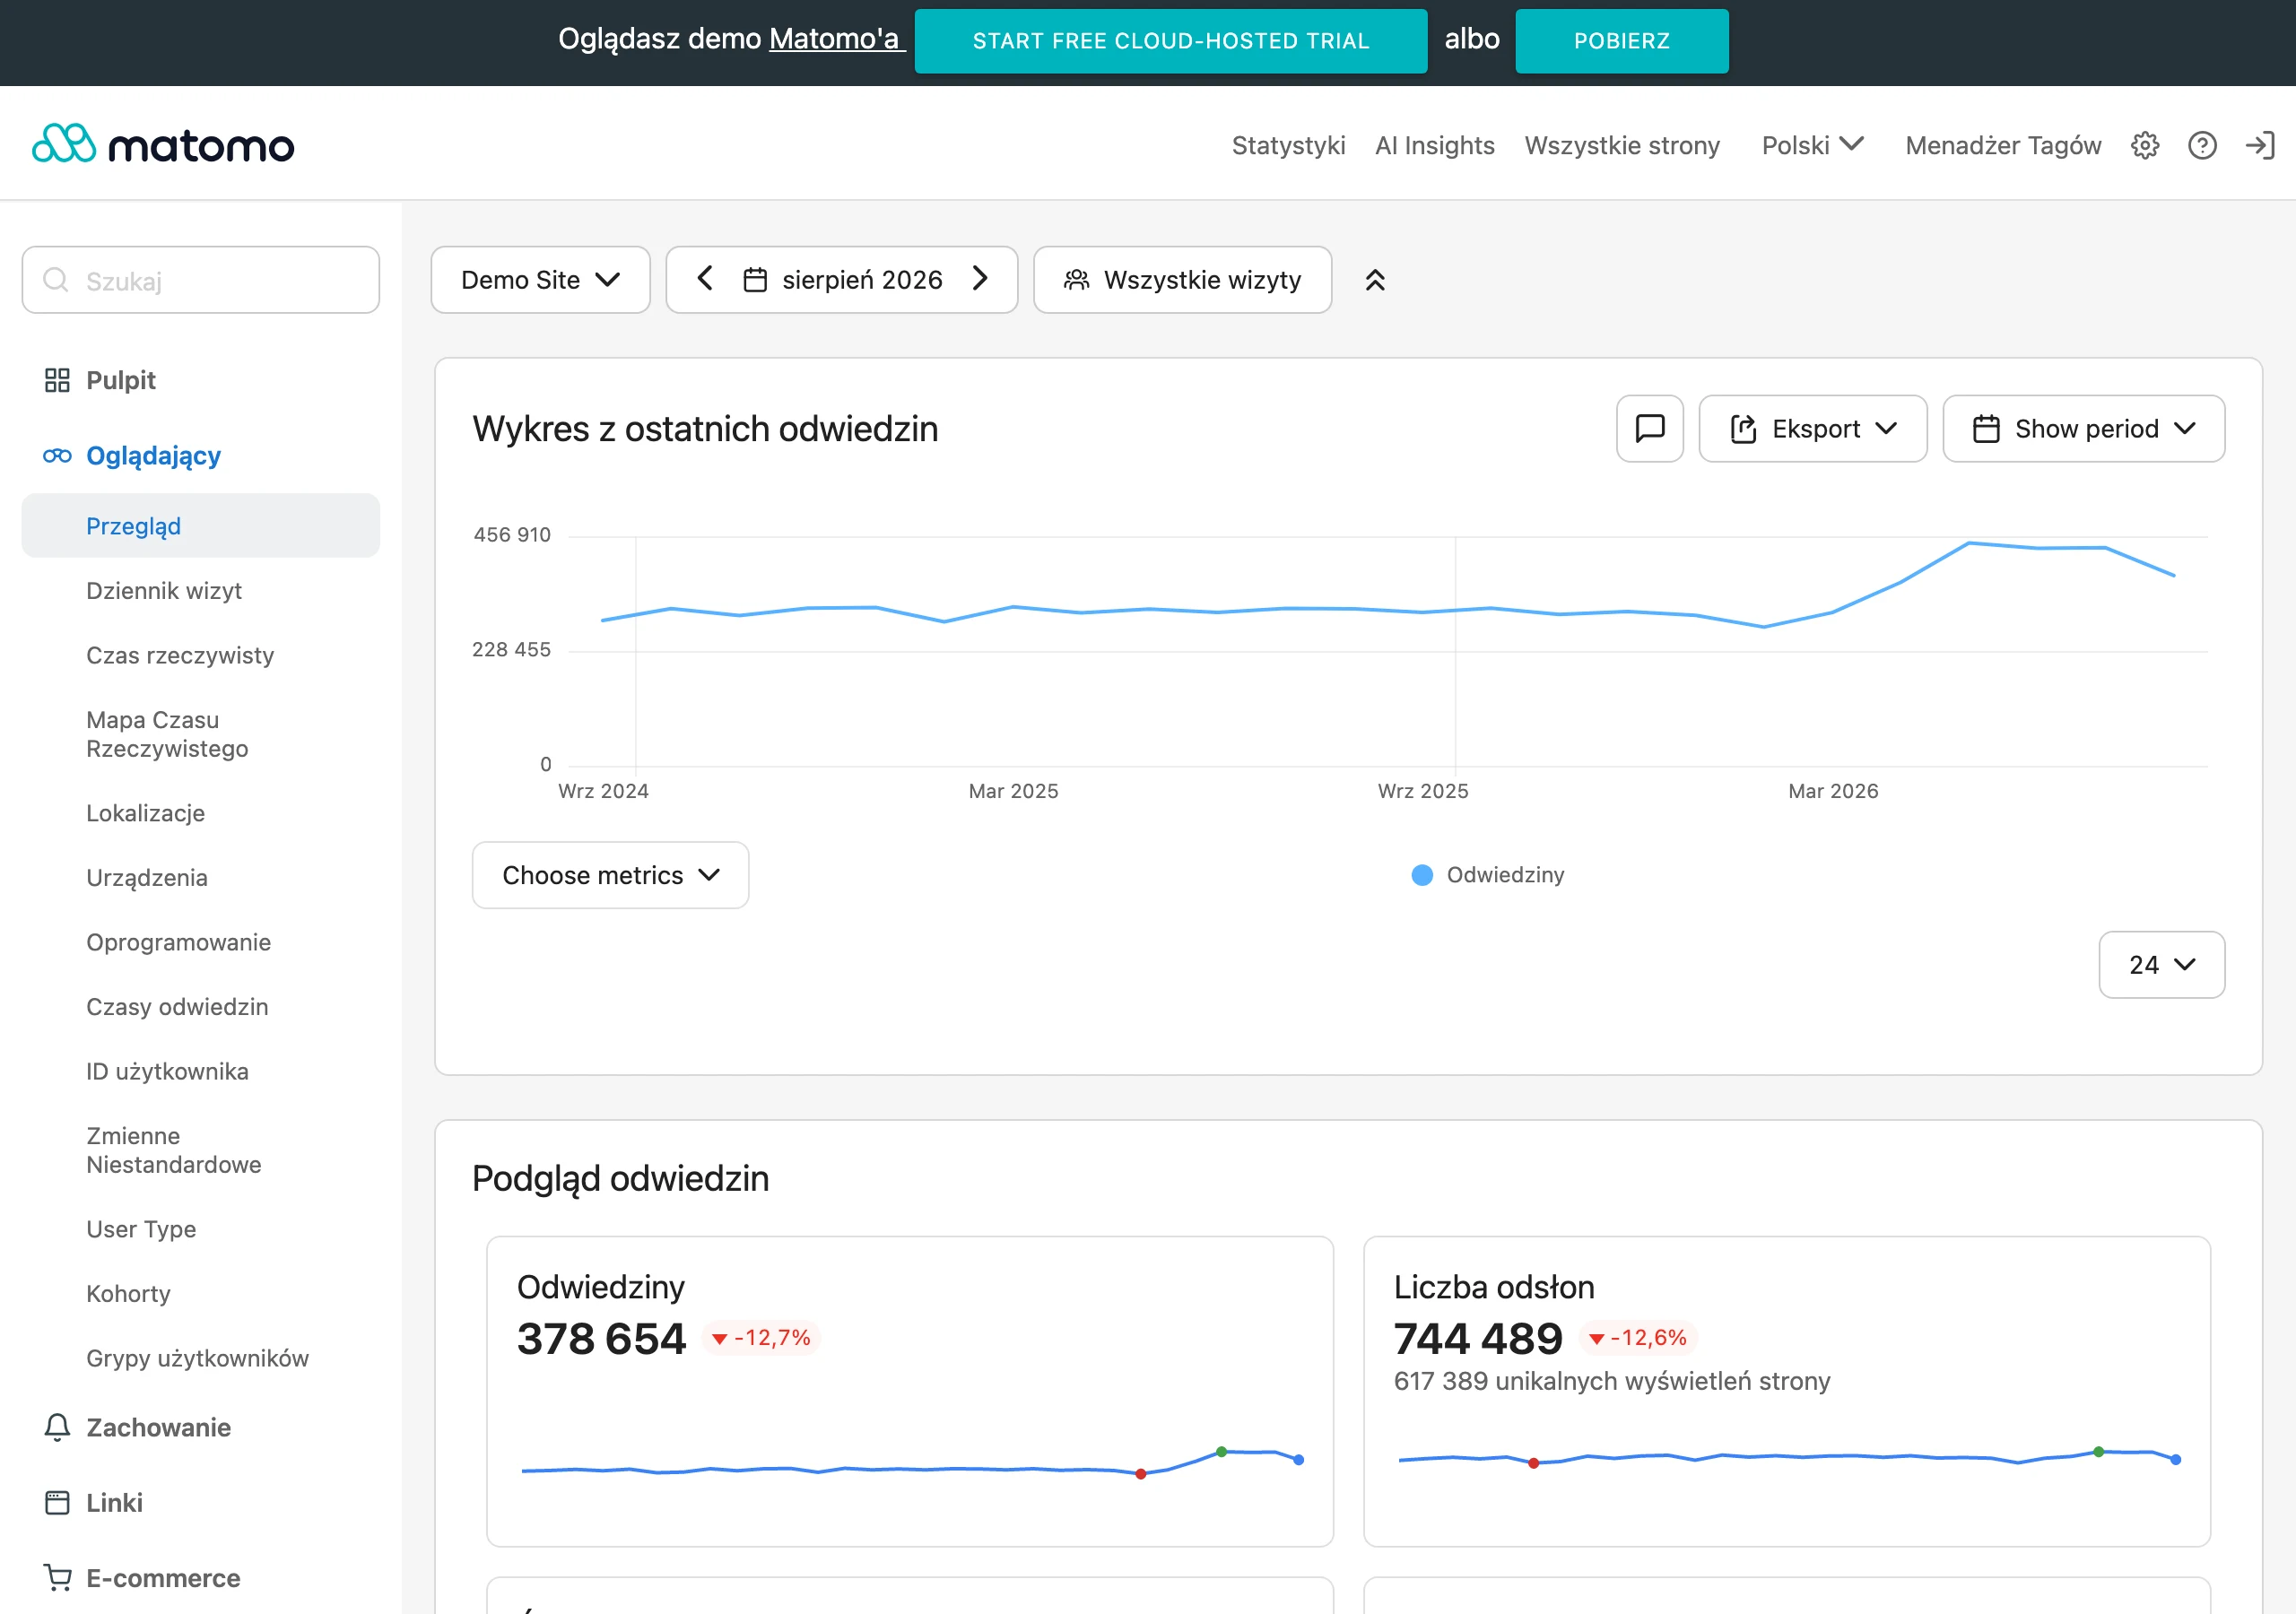
GA4 no longer works exactly like Universal Analytics, so interpreting Direct requires greater care. When you analyse sessions, you are checking how a specific visit was classified. When you look at users, a broader acquisition context and earlier interactions come into play. In practice, this means that one “increase in Direct” can look different depending on which report you open.
Consent and privacy restrictions also increasingly affect measurement. Consent banners, blockers, browser settings and traffic from embedded apps can cut off source identification, even if the campaign was planned correctly. It is not always an implementation error on the marketing side, more often it is the result of the environment in which the user opens the link. That is why sudden changes in Direct are worth comparing also by devices, browsers and countries.
Technical changes on the site and cross-domain flows also matter a great deal. Website migration, CMS change, new redirects, launching a basket on another domain, a payment gateway or a tagging tool can change the share of Direct without any change in real demand. This happens especially often when campaign parameters or the referrer stop being passed on. A drop in Direct after a correct UTM, cross-domain or redirects implementation can be good news, because it means recovering data about the true traffic sources.
In practice, it is not worth assessing Direct in isolation from the other channels. If the share of Direct rises in parallel with growth in branded queries and visits to the homepage, this can support the thesis of rising awareness. However, if it rises after technical changes are implemented or at the same time as e-mail, social or referral drops, distorted measurement is more likely. That is why this channel has to be read in the context of the entire acquisition model, rather than treated as a stand-alone success metric.
How do you diagnose a rise or fall in Direct Traffic?
A rise or fall in Direct Traffic is diagnosed by checking where exactly the change appeared and whether it concerns real user behaviour, or only a loss of source data. Start by comparing sessions, users and conversions, then break the result down by devices, countries, browsers and landing pages. In GA4 this matters a great deal, because the same problem may be visible in one report but not in another. The most convenient place to start is Traffic acquisition, then move on to Landing page and Source/Medium.
The next step is to assess the quality of this growth. If Direct is rising, but at the same time you can see weak engagement, a low conversion rate and a large share of new users, it is usually not “clean” Direct, but traffic with a lost source. If, on the other hand, it is rising together with conversions, returning users and visits to the homepage, it may be the effect of brand activity. A rise in the number of sessions from the Direct channel does not prove anything on its own.
The analysis of landing pages tells you a lot. Growth in Direct on the homepage, contact page or under a short URL is often natural, because users type such addresses manually or have them saved. It looks different when Direct grows on long URLs, campaign pages, blog posts with an extended URL or addresses with parameters. A high share of Direct on deep landing pages more often points to an attribution problem than to real manual visits.
Next, check the places where the source could have been “lost”. This most often involves newsletters without UTM, links in messengers, SMS, PDFs, QR codes, mobile apps, link shorteners and redirects that remove campaign parameters. It is also a good idea to compare Direct with the channels that usually “give” it traffic, namely e-mail, social, referral and paid. If Direct grows at exactly the same time as one of these channels drops, that is strong evidence that the problem is technical or caused by tagging.
Finally, it is worth overlaying the chart with dates of changes on the site and in tools. A domain migration, new CMS, change of mailing system, implementation of a consent banner, a new redirect or a correction to the cross-domain configuration can trigger a spike in Direct without any change in demand. The best diagnosis usually does not come from a single report, but from combining analytics data with the implementation history. Without that, it is easy to mistake a measurement error for brand success, or vice versa.
- 01Compare sessions and usersAnalysis of changes in quantitative metrics
- 02Break the results down into segmentsDevices, countries, browsers, landing pages
- 03Assess traffic qualityEngagement, conversion, share of new users
- 04Verify “clean” DirectDistinguishing real behaviour from lost source data
In GA4, diagnosis requires checking different reports (Traffic Acquisition, Landing Page) to avoid misinterpreting the data.
What should you do operationally to manage Direct Traffic?
To manage Direct Traffic, you first need to recover lost sources and distinguish genuine direct traffic from attribution errors. In practice, this means structured tagging, redirect control and regular landing page audits. The aim is not to “reduce Direct at all costs”, but to assign visits correctly to the right channels. A drop in Direct after fixing measurement is often good news.
The first area is link tagging. All entries from newsletters, sales e-mails, SMS, messengers, PDFs, QR codes and offline activities should have proper UTM parameters. Without this, some of the traffic will end up in Direct, even though it comes from a specific campaign. If a channel can be tagged, there is no point in hoping that Google Analytics will identify it on its own.
The second area covers the technical path the user takes through the site. You need to check whether redirects carry campaign parameters, whether there are unnecessary redirects between domain versions and whether the cross-domain configuration includes all touchpoints the user passes through. This is especially relevant for subdomains, the basket, payment systems, forms and external tools. Even a correctly tagged campaign stops being readable if the parameters disappear along the way.
The third area is consents and tag firing. It is worth checking whether Consent Mode works as intended, whether tags fire at the right moment and whether the latest implementations have not disrupted the measurement logic. Problems with consent banners, blockers and in-app browsers cannot always be fully eliminated, but you need to establish when they started affecting the data. A sudden increase in Direct after a change to the consent mechanism more often indicates a change in measurement than a change in user behaviour.
The fourth area is ongoing reporting analysis. Direct is best assessed in parallel in session default channel group, source/medium and landing page, because only this combination gives the full picture. Pay particular attention to deep pages, i.e. addresses that users rarely reach “from memory”. If Direct is rising precisely in these places, treat it as an audit priority.
At management level, a simple change log works best. Record the dates of technical deployments, campaign modifications, implementations of new email tools, changes to links in apps and updates to the consent banner. This makes it easier to connect a spike or drop in Direct with a specific event. Without documentation, even a correct analysis is sometimes guesswork rather than diagnosis.
When making decisions, use one practical criterion. If Direct grows alongside brand traffic, homepage entries and returning users, this more often points to a genuine brand effect. If, however, it grows after technical changes, on long URLs or alongside a drop in other channels, it usually signals a measurement issue. This distinction matters more than Direct’s percentage share of total traffic itself.
The most common mistakes and pitfalls related to Direct Traffic
The most common mistake is treating Direct Traffic as unequivocal proof of brand strength, even though this channel often includes traffic with a lost source. In practice, this means that some visits attributed to Direct did not start with a manually entered address at all. If Direct grows, do not automatically assume increased brand awareness.
The second pitfall is analysing the channel share alone without checking which pages users land on. Growth in Direct on the homepage, contact page or a short address can be natural. By contrast, growth on long campaign URLs, product pages with parameters or landing pages used in advertising more often points to an attribution problem than to genuine direct visits.
A very common reason for inflated Direct is untagged links operating outside the classic web. This applies to emails, newsletters, SMS, messengers, QR codes, PDF files and some mobile apps. When a link does not pass the referrer and there is no UTM, Google Analytics most often has no basis to recognise the source and classifies the session as Direct.
- lack of UTMs in email, SMS and offline materials,
- redirects that “eat” campaign parameters,
- incorrect cross-domain between the main domain, basket and payments,
- comparing reports with different acquisition dimensions in GA4,
- ignoring the impact of consents, blockers and browsers on the loss of source data.
Another pitfall is relying on just one report in GA4. The same traffic can be shown differently in Traffic acquisition, differently in Source/Medium, and yet differently when analysing landing pages. Direct is worth assessing in parallel at session level, landing page level and in the context of technical changes, because otherwise it is easy to reach the wrong conclusion.
Many teams also underestimate the impact of technical implementations. A CMS change, domain migration, a new email system, new link shorteners, adjustments to the consent banner or a change in how tags fire can shift Direct’s share overnight, despite no change in demand whatsoever. That is why a sudden spike or drop should always be confronted with the implementation calendar.
A common mistake is also treating a drop in Direct as a problem. Often the opposite is true. After refining campaign tagging or the measurement configuration, some traffic returns to the correct channels, such as email, social or paid. A drop in Direct may mean better data quality, not worse marketing performance.
- 01Assumption of brand strengthIncorrect attribution source
- 02Channel share analysisWithout checking landing pages
- 03Inflated Direct (long addresses)Campaign attribution issues
Summary: Direct Traffic does not always mean a strong brand; verify sources and landing pages.
The business significance of changes in Direct Traffic
The business significance of changes in Direct Traffic depends on whether you are seeing a real increase in direct visits or rather a shift of traffic from other channels. This distinction is crucial, because it affects the assessment of marketing effectiveness, budgets and conversion attribution. The same increase in Direct can be good news or a sign that data is slipping through the net.
If Direct grows alongside brand traffic, homepage entries, returning users and stable session quality, this more often indicates growing brand awareness. In such a scenario, users really are coming back to the site on their own or via saved links. This signal has business value, because it usually supports cheaper traffic acquisition and strengthens the effects of remarketing and brand activity.
However, if Direct grows alongside a drop in email, social, referral or paid campaigns, until the causes are ruled out you should assume a measurement problem. In that case, the reports begin to understate the channels that genuinely deliver users and conversions. Inflated Direct distorts budget decisions, because it looks as though some sales “appear by themselves”.
In business practice, the quality of this traffic matters particularly. Genuine Direct is more often associated with better engagement, a higher number of returning users and more predictable paths to conversion. Artificially “pumped up” Direct, on the other hand, can be chaotic: it brings in more new users, produces weaker consistency in landing pages and shows an illogical distribution across devices or countries.
A drop in Direct can also be significant, but it is not always bad news. If, after implementing UTM tags, improving redirects or configuring cross-domain tracking, the share of Direct falls, the company regains clarity over which channels are actually doing the work. This usually translates into better campaign planning, a more accurate assessment of ROI and smoother communication between marketing, analytics and sales.
The most practical rule is simple: interpret Direct only after comparing it with data on landing pages, technical changes and trends in other channels. An increase in Direct on the homepage more often supports the brand hypothesis, while an increase on deep pages after technical changes more often points to a measurement issue. Such an interpretation has real business value and leads to sensible decisions.
FAQ
Frequently asked questions
How can you tell whether a rise in Direct Traffic comes from the brand or a measurement error?
Check whether homepage visits, branded traffic and conversions are rising alongside Direct. If the increase appears on long URLs or other channels are falling at the same time, it is more often about lost source data.
Why does Direct Traffic rise after technical changes on the site?
Changes such as a domain migration, a new CMS, redirects, cross-domain tracking or a payment gateway can interrupt the passing of the referrer and campaign parameters. In that case GA4 assigns more sessions to Direct, even though the traffic has not actually become direct.
When is Direct Traffic most natural?
It is most natural for visits to the homepage, short and easy-to-remember URLs, and pages regularly visited by returning customers. This pattern fits manual address entry or a visit from a bookmark.
Can Direct Traffic include traffic from emails, SMS messages and messengers?
Yes, if links do not have UTM parameters or the parameters disappear along the way, GA4 may assign the session to Direct. This also applies to PDFs, QR codes and some mobile apps.
Which GA4 reports are best for analysing Direct Traffic?
It is usually worth comparing Traffic acquisition, Landing page, Source/Medium and Default channel group. Only comparing these views shows whether real user behaviour changed, or just attribution.
Is a drop in Direct Traffic always a bad sign?
No, a drop in Direct may mean improved measurement and recovery of traffic into the correct channels, such as email, social or paid. If Direct falls after tagging is fixed, that is often good news for data quality.