
It is better to read changes in Google as a diagnosis, not as an alarm to rebuild the site. A drop in rankings, clicks or conversions alone tells you very little about what actually happened and where the source of the problem lies. First, separate the impact of the algorithm, technical changes, measurement errors, seasonality and shifts in user intent. The biggest mistake is reacting to the first chart without checking whether the change is real, commercially significant and measured correctly. What matters in the game is not theory about updates, but a cool-headed decision: what to fix, what to monitor, and what not to touch for now. And that is done faster when you cut the data into segments instead of looking only at the average for the whole domain.
How to interpret sudden changes in Google results effectively?
You interpret sudden changes in Google results effectively when you first confirm exactly what has shifted. Only then do you look for the cause, separating the layers: visibility, clicks, CTR, conversions, indexing and measurement quality. A drop in one metric does not have to mean the same problem as a drop in another. The question is: what has really fallen, and what only looks alarming on the chart.
In practice, you combine data from several sources. Google Search Console, GA4, visibility monitoring tools, a crawler, server logs and implementation history only together form a meaningful story about what has happened. Search Console shows the effect in the form of impressions and clicks, but on its own it does not explain the mechanism. A coincidence between the date of a drop and a Google update is only a signal to investigate, not proof. And this is exactly where it is easy to confuse correlation with causation.
It is also crucial to look at segments, not at an averaged picture of the whole site. Brand and non-brand queries, mobile and desktop, countries, directories, page types and query classes are analysed separately. If the problem concerns one section, the response should concern that section, not the whole domain. Instead of a big revolution — a precise cut.
Not every change requires immediate action. A drop in clicks can result from a fall in CTR, new modules in the SERP, a greater number of no-click answers or entering broader, less relevant queries. Sometimes the best decision is to keep monitoring if the data does not confirm a lasting and widespread problem. Rushing is tempting, but it is most often what produces the wrong fixes.
Key stages of analysing changes in visibility and traffic
The key stages of analysing changes in visibility and traffic are simple, but merciless towards shortcuts: you confirm the change, build a timeline, segment the problem, carry out a technical verification, analyse the content and only then decide on actions. This order reduces the risk of hasty conclusions, because you do not confuse the symptom with the cause. First you establish the fact, then the scope, and only afterwards the mechanism.
The first stage is checking whether the deviation is real and what exactly it concerns. A drop in clicks with stable impressions is read differently from a drop in the number of indexed pages or a sudden change in conversions from organic traffic. At this level, compare data not only week on week, but also year on year, necessarily broken down by segment. Only then can you see whether you are dealing with a one-off plunge or a trend that will be costly.
The second stage is straightforward in principle, but tricky in execution. You build a timeline and check what exactly happened just before the change. The dates of drops or increases need to be matched with site deployments, template changes, migrations, modifications to internal linking, robots settings, canonicals, sitemaps and the publication of new content. The problem is that without such a chronology it is easy to fall into a false lead. Without deployment history, it is very easy to confuse an algorithmic effect with your own technical mistake.
The third stage is segmentation. Without it, you are groping in the dark. The aim is to determine whether the problem is domain-wide, section-specific or limited to a particular type of query. In practice, you check which directories lost visibility, which devices are affected by the change, whether transactional or informational pages were hit, and whether the drop concerns brand or non-brand. The question is: what exactly has “fallen”, and what only looks like a fall in the average. It is usually the fastest way to narrow down the number of possible causes.
The fourth stage is technical verification. There is no room for guesswork here. The analysis should cover indexing, 4xx and 5xx errors, redirects, blocking in robots.txt, meta robots, canonicals, JavaScript rendering, template performance and HTML availability for robots. But beware, one detail can “bring down” the whole picture in Search. If Google cannot correctly fetch, render or understand a page, further content analysis will be secondary.
The fifth stage concerns content, intent and page quality against the current search results landscape. This is the moment when cable checks end and the conversation about meaning begins. You need to compare the pages that are losing with those that have maintained their results: do they answer the same intent, do they have a similar scope of information, are they up to date and do they show the entity’s credibility. The facts are that without such a comparison it is easy to mistake “worse content” for “a different intent”. Only after such a review can you sensibly classify the problem as technical, content-related, intent-related, link-related, measurement-related or mixed, and prioritise the actions.
The role of segmentation and technical verification in diagnosing problems
Segmentation and technical verification show where the problem really occurs and whether its source is Google, the site or the measurement itself. It works like a torch, not a hammer. Without dividing the data, it is easy to assume that “the whole domain has dropped”, when in practice the change may concern only mobile, one directory or non-brand queries. And that is not a detail, but the foundation, because the scale of the response depends on it. You work differently on a technical error in a category template and differently on a temporary drop in CTR for informational queries.
The most useful breakdown can be surprisingly “down to earth”. Usually: brand and non-brand, mobile and desktop, country, directory, page type and query class. Such a structure quickly shows whether the drop concerns transactional, guide-style or local traffic, or only a specific section of the site. If the problem is visible only in one segment, there is no reason to rebuild the entire domain. Instead of revolution — precise correction.
In practice, it is worth comparing not only the whole domain, but also groups of URLs that share a template or the same business function. That makes a difference. If only filter pages, only articles from a specific period, or only subpages rendered in JS are dropping, that is a strong diagnostic clue, not “noise”. Let’s look at it differently: such a picture is far more valuable than the average position for the entire site.
Technical verification answers a simple question: can the Googlebot fetch the page, understand it and index it at all. It sounds basic, but in practice it is a quick test of whether you are losing out to mechanics before you start discussing algorithms. So you check server response statuses, 4xx and 5xx errors, redirects, canonicals, robots.txt blocks, meta robots, and whether the important content sits in HTML rather than appearing only after script rendering. Some drops look like an “algorithmic problem”, but in reality they stem from one fact: Google sees less content than the user.
Indexation and server logs are also highly important. They show whether Google is going where it should, or just wandering around. A drop in the number of active pages in the index, restricted crawl of important sections, or a sudden rise in bot visits to low-value URLs often points to an architecture or duplication problem. Logs show Googlebot’s behaviour in practice, not just the claims of tools.
It is also not worth sweeping template performance and deployment changes under the carpet. Sometimes it takes just one new component, a heavier frontend, changed internal linking, or an incorrect sitemap to trigger a domino effect. First comes poorer rendering, then weaker bot traversal, then slower index refresh, and finally a drop in visibility where things had previously been calm. And then the question is: algorithm, or your own work. Without lining up the drop against the deployment timeline, it is easy to blame the algorithm for your own technical mistake.
Analysis of content and quality signals in the context of algorithmic changes
Analysis of content and quality signals checks one thing: whether the page still answers the query intent better, or at least as well, as the documents that are winning in the results today. When the SERP layout changes, the mere presence of a phrase in the text stops being a sensible measure of relevance. The key is to compare losing pages with the current results, not with how the market looked a few months ago. Instead of looking back — you look at what Google is showing now.
The first step is to assess search intent. If Google has started promoting guides, comparisons or category pages for a given query, and you are still sticking with a sales landing page with sparse information, the drop does not have to mean a penalty or a technical error. Very often the problem is not the quality of the content itself, but the mismatch between its type and what the user expects. And that is what hurts most, because it is usually not visible in reports.
Then you move on to topic coverage, information structure and the specificity of the answer. Losing pages often have too few relevant subtopics, a weak information hierarchy, outdated data, or text written “around” the issue, without solving the user’s real problem. A good comparison is not only about content length, but also whether the page answers the questions that are actually surfacing in the current SERP. The data makes it clear: it is not the one who writes more who wins, but the one who hits the target more precisely.
When algorithms change, the quality and trust signals visible on the page also matter. This is about clear information on the company, contact details, offer terms, authorship, content freshness, and consistency between the page’s promise and what the user gets after entering. It does not work like a single “ranking button”, but note this: it can reduce situations where the content looks random, anonymous or poorly controlled. It is not about decorative extras, but about credibility that can be verified.
Category pages and guides need to be examined under a magnifying glass. That is where quality differences show up fastest after updates. A category with a thin description, weak filters and chaotic linking can lose not because it “has too little text”, but because it guides the user badly towards a decision. A guide, on the other hand, loses when it stands still, has no fresh data, lacks trust sources, or only scratches the surface of the topic.
The safest approach is to compare three groups: losing pages, stable pages and growing pages within the same site. That way it becomes easier to see whether the problem affects the whole content creation approach, just one template, or perhaps a specific class of topics. If some similar pages have maintained their rankings, that is usually a sign that measurable differences can be found and improved without chaotically rewriting everything.
How to avoid typical mistakes when reacting to Google changes?
First brake, then analyse. Errors are reduced when you stop reacting impulsively and check what exactly changed, where and since when. A drop in a rank-tracking tool does not yet have to mean a business problem. A fall in clicks is read differently, CTR differently again, and conversions or the number of pages in the index differently still.
The most common trap is looking for one cause for everything. In practice, the result is shaped at the same time by changes in the SERP, seasonality, previous deployments and differences between brand and non-brand. And the question is: what exactly is muddying the data. If you do not separate these layers, it is easy to blame the algorithm, even though the problem sits in the template, indexation or the measurement itself.
The second costly mistake is rolling out many fixes at once. Changing titles, content, internal linking, structured data and URLs at the same time takes away any sensible way to assess what worked and what merely added noise to the picture. First you remove critical errors, then you implement changes in stages and record their dates.
Many teams react too broadly to a problem that is too small. If the drop concerns only one section, one device or a class of queries, rebuilding the entire domain is like using a sledgehammer to crack a nut. The response should match the scale of the change, because large rebuilds increase the risk of new technical and content-related issues.
There is also no point in mass-deleting content just because it has lost traffic. First, you need to check whether the page has stopped matching intent, whether it has been weakened by internal linking, whether it is competing with another subpage, and whether it still delivers business value. A drop in traffic is not automatically proof that the content is unnecessary.
Also be careful with the Google update calendar. Matching dates is an important signal, but still not proof. If the drop coincided with an update, compare the pages that lost traffic with those that held their results, and look for differences in template quality, information structure, content freshness and trust signals.
Another mistake is lumping data from different sources together without understanding what they are even for. Google Search Console shows the effects on visibility and clicks, GA4 reveals behaviour and conversions, while a crawler and logs let us pinpoint the technical source of the problem. A rankings monitoring tool is useful for capturing the scale of fluctuations, but it cannot be the only basis for diagnosis.
Sometimes the best decision is not immediate implementation, but simple observation. Short-term fluctuations are normal, especially when you cannot see them at once across several segments and metrics. If you do not have confirmation in broader data, it is better not to make moves that will only make interpretation harder in two weeks’ time.
Importance of precise measurement and monitoring of results after implementations
Precise measurement and post-implementation monitoring are needed to distinguish real improvement from noise in the data and to check whether the change worked exactly where it was meant to work. In SEO, simply looking at the whole domain is usually not enough. What matters is what is happening at the level of sections, page types, devices, countries and query classes.
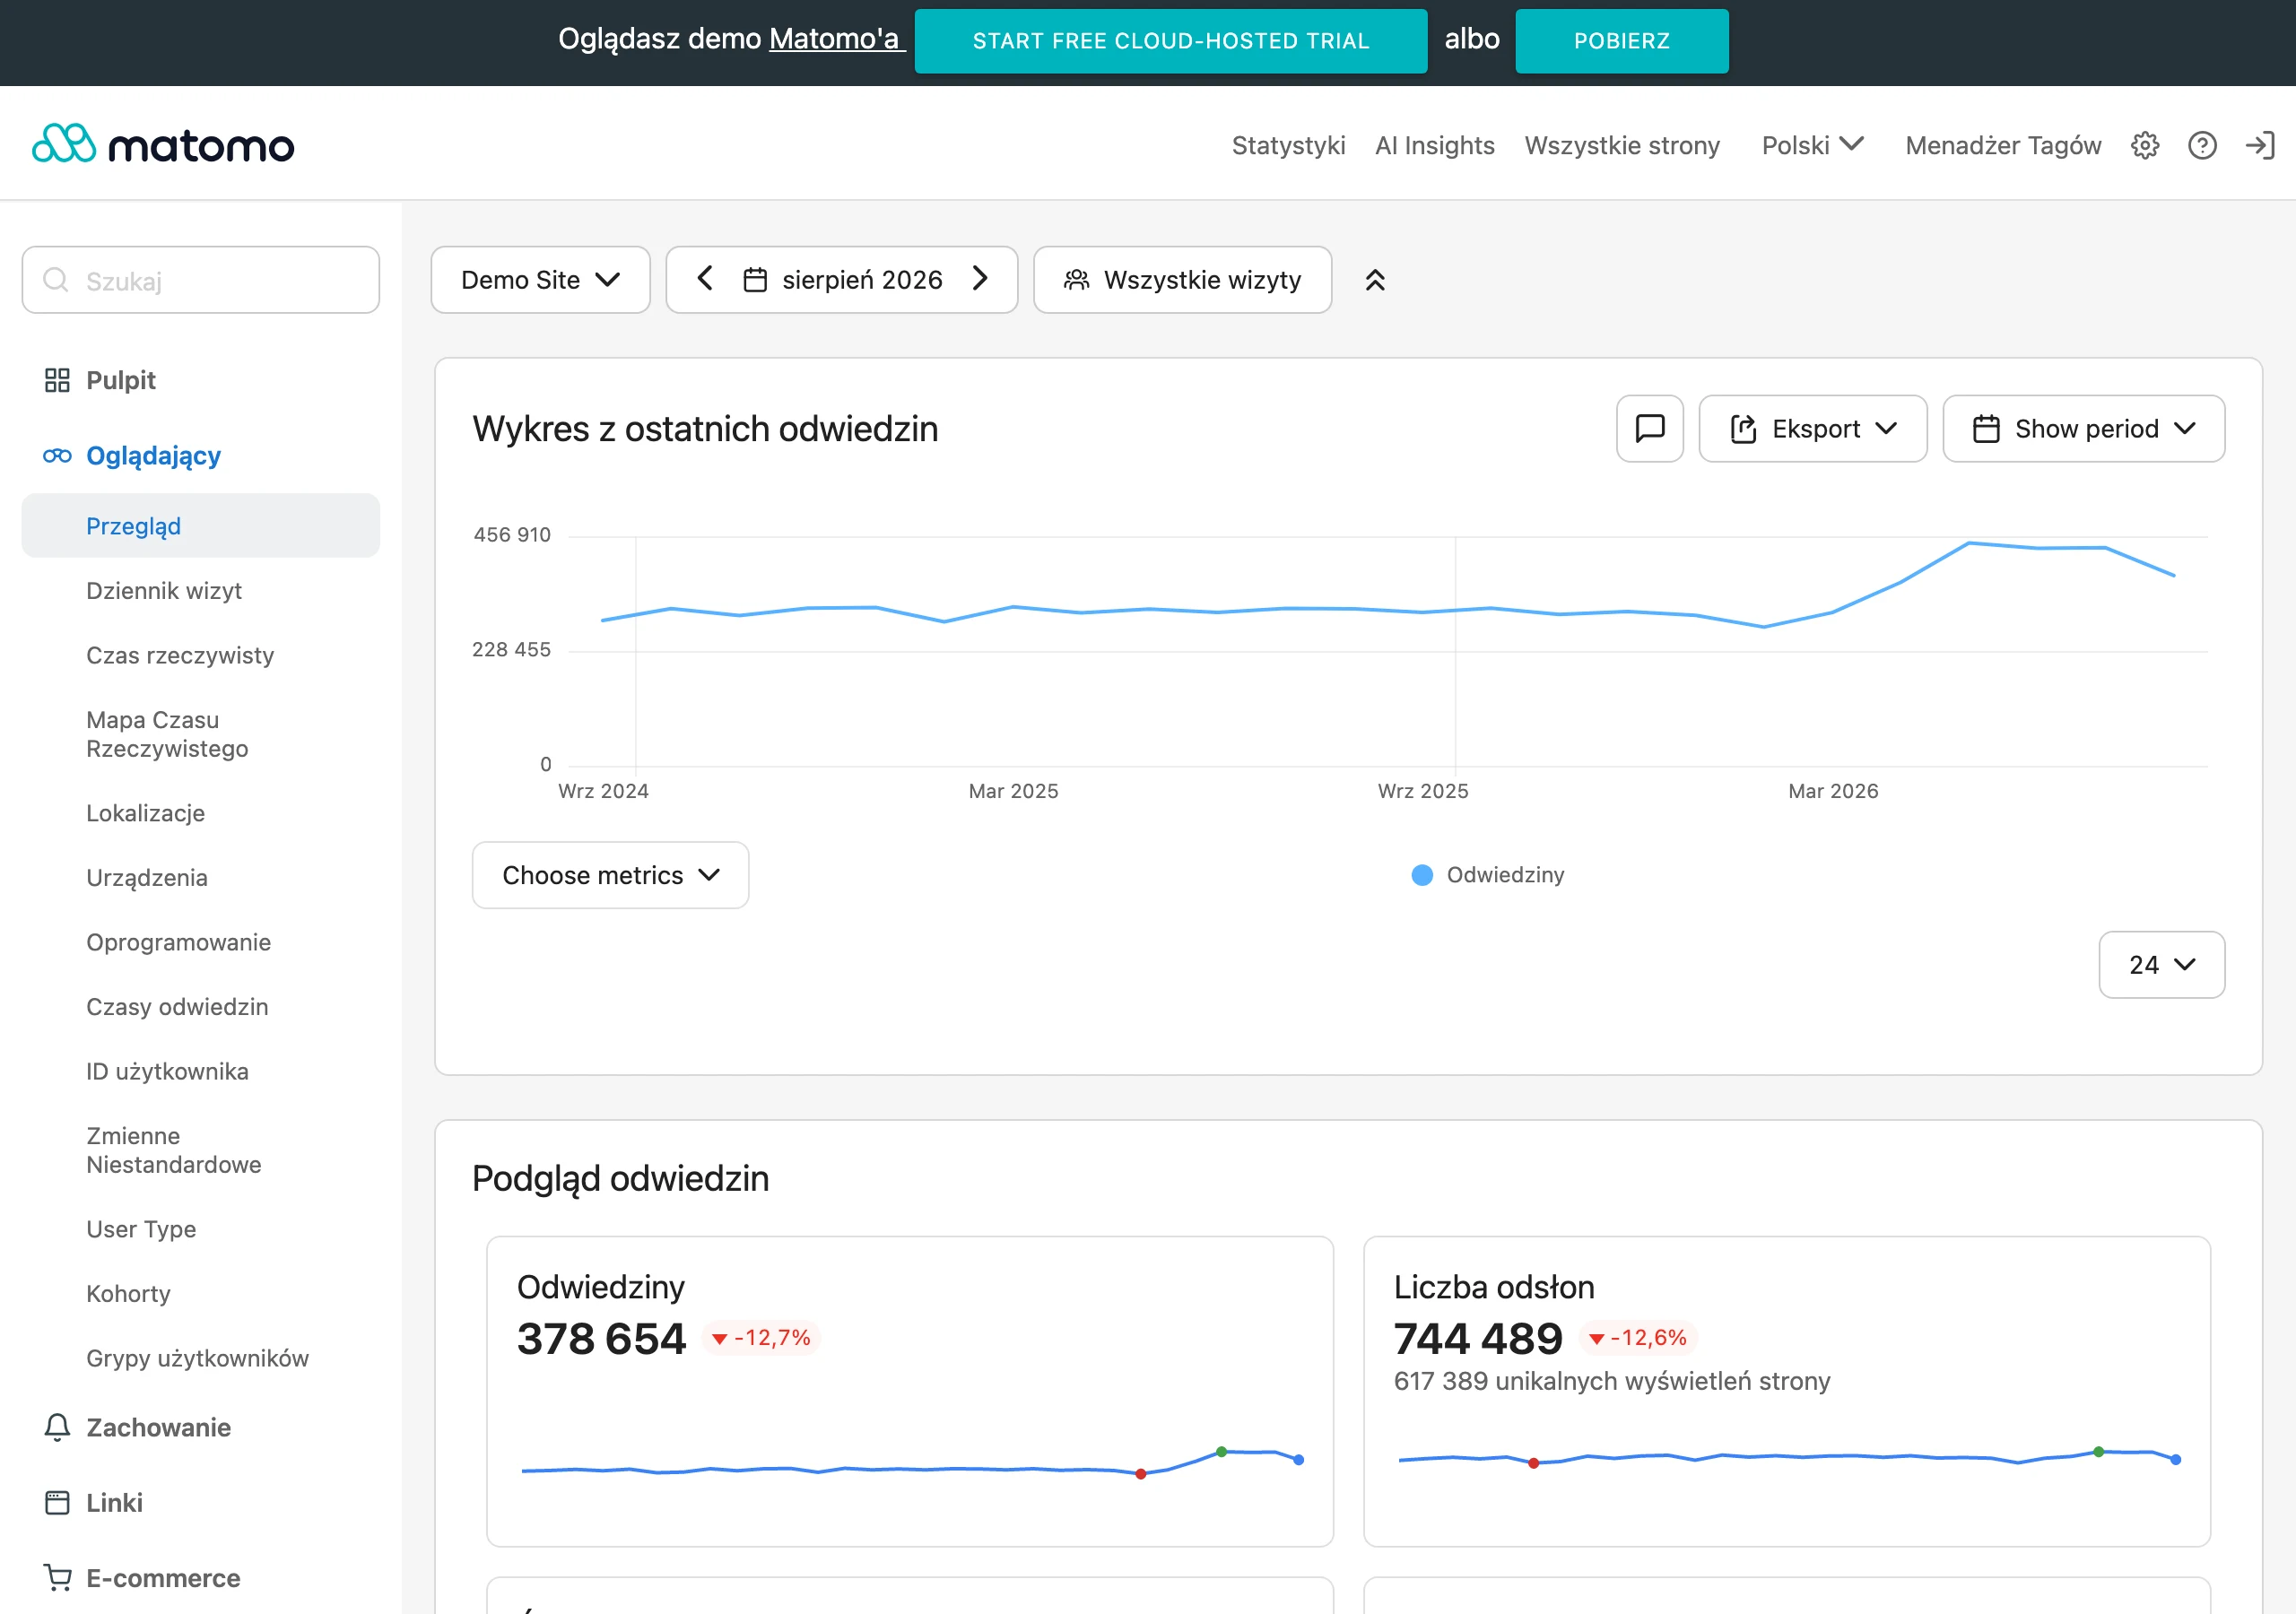
Before implementation, you need to establish a baseline. Specifically: the start date, the scope of the change, the list of URLs or templates it affects, and the set of metrics that are meant to improve. Without a clear starting point, after a few weeks it is hard to judge fairly whether the result comes from the implementation, seasonality or changes on Google’s side.
The most useful monitoring combines several data sources. And that is not a cliché, because each of them answers a different question.
- GSC: clicks, impressions, CTR, position and queries for specific pages and segments.
- GA4: user behaviour after landing, traffic quality and impact on conversions.
- Crawler: technical errors, statuses, redirects, canonicals, blocks and architecture.
- Server logs: real Googlebot activity and changes in crawl budget.
- Implementation log: exact date, scope, environment and responsible team.
After implementation, it is not enough to look at the trend for the whole domain. If you are improving category pages on mobile, that is exactly the segment that should be under the microscope first. An averaged uplift across the whole site can hide the fact that the implementation did not help the area that was meant to be fixed.
The time horizon for evaluation also matters. Some technical changes show results quickly, for example after removing an indexing block, but improvements after content or structural changes usually need more time. Drawing a conclusion too early ends either with rolling back changes prematurely or with adding further fixes without knowing what is actually working.
Monitor not only improvement. The problem is that one change can increase impressions while at the same time lowering CTR or pushing traffic towards informational queries with lower business value. Why celebrate visibility if traffic quality is dropping. That is why the evaluation must cover visibility, query structure, traffic quality and conversions all at once.
Measurement itself is often the big problem. Changes in tags, user consent, the attribution model or event configuration can produce an apparent drop or an equally apparent increase, and then everyone looks at SEO as the culprit. The data says it clearly: before drawing conclusions, make sure you are measuring the same thing as yesterday. If the numbers look illogical after implementation, first check analytics, and only then assess SEO effectiveness.
Good monitoring ends with a decision. Not “we keep observing”, but: the implementation is working and can be scaled up, or there is no effect and we go back to diagnosis, or the results are inconclusive and further observation is needed. That is the difference between operational work and running after charts. Only this model limits chaos and lets you learn from your own implementations instead of reacting to every chart separately.
FAQ
Frequently asked questions
How can you effectively interpret a sudden drop in Google rankings?
First, you need to establish what exactly dropped: visibility, clicks, CTR, conversions or indexation. Only then do you look for the cause, comparing data from several sources and looking at segments, not just the average for the whole domain.
Does a drop in clicks immediately mean a problem with content or the Google algorithm?
No, because a drop in clicks can also result from a lower CTR, changes in the SERP, zero-click answers or broader, less relevant queries. The chart alone does not yet show the source of the problem.
Why is it worth splitting data into segments instead of analysing the whole domain?
Because the problem may affect only mobile, one directory, one country, a page type or branded and non-branded queries. This breakdown quickly shows where the change is really happening and how big the response should be.
What technical elements should you check when rankings drop in Google?
You need to verify indexation, 4xx and 5xx errors, redirects, robots.txt, meta robots, canonicals and JavaScript rendering. The performance of templates and whether the content is available in HTML for crawlers are also important.
When can a drop in results be caused by a search intent problem?
When Google starts promoting a different type of page than yours, for example guides, comparisons or categories, while the site still answers with a different format. In that case, the problem may be a mismatch between the content type and user expectation, not an algorithmic penalty.
How can you avoid hasty action after changes in Google?
First, you need to confirm whether the change is real and materially important for the business, and only then implement fixes. The mistake is making many changes at once, because then it is hard to assess what actually worked.