
Bounce rate is one of those metrics that are easy to misread. On the surface it seems simple, but in practice it often says more about content fit and traffic quality than about the site’s “popularity” itself. The key point is that a high bounce rate does not always signal a problem, and a low one does not always indicate success. To draw accurate conclusions, it is worth understanding how the tool counts bounces and what goal a given page is meant to achieve. A blog post is assessed differently from a service page, and a landing page from a campaign is assessed differently again. In this article we discuss the practical meaning of the metric and how to analyse it so that it leads to sensible decisions.
What bounce rate is and how to understand it in practice
Bounce rate is the percentage of visits that end without another meaningful interaction with the website. It is best treated as a diagnostic indicator, not a final verdict on the quality of the page. It shows that the user entered and did not take the next step, but the result itself does not yet explain why.
It is most often analysed for entry pages, that is, those where the session starts. If a user lands on a landing page from an ad and leaves immediately, this may point to poor message fit, an unclear above-the-fold section or low-quality traffic. This metric only becomes meaningful once you set it against context: the source of the visit, the type of page and the user’s intent.
Interpretation depends on the role a given page plays. On a sales page, a high result usually acts like a warning light, because it means a lost chance for contact, a lead or a purchase. On a page with simple information, a phone number or opening hours, such a result does not have to indicate an error if the user immediately found what they came for.
In practice, it is worth looking not only at the rate itself, but also at what happens next, or does not happen at all. If a page has a high bounce rate and at the same time low scrolling, few clicks and little movement to other pages, the problem becomes more likely. If, however, users find the answer quickly, a high result alone should not force changes for the sake of it.
It is also a useful signal when assessing the quality of traffic from campaigns. When one channel generates a lot of visits but users leave the page en masse after a few seconds, it is worth looking not only at the page itself, but also at the ad, the keywords, the audience segment and the promise contained in the message. Often the source of the problem lies not in the website, but in the fact that the wrong people are being sent to it.
Current measurement methods and their impact on analysis results
Current measurement methods mean that bounce rate depends on how the tool defines user engagement. This matters because the same traffic can look different in two separate analytics systems. That is why, before analysing, it is worth checking exactly what “bounced session” means in the tool you are using.
In modern analytics, the metric more often reflects a lack of engagement than the mere failure to move to another page. This means that the way events are configured has a direct impact on the result. If you add events too broadly or mistakenly mark them as key, you can artificially lower bounce rate without any real improvement in the user experience.
It is not worth comparing results one-to-one between different systems or after changing the measurement setup. Swapping tags, implementing new events, correcting analytics consent or removing duplicate scripts can suddenly shift reports, even if user behaviour remains similar. This is a common source of misleading conclusions after an analytics migration or website rebuild.
Technical factors and data quality also affect how the metric is read. Script blocking, missing marketing and analytics consent, bot traffic, incorrect tag implementation or double-counting page views can seriously distort the picture. Before you start optimising the site, make sure you are measuring user behaviour rather than the effect of a faulty configuration.
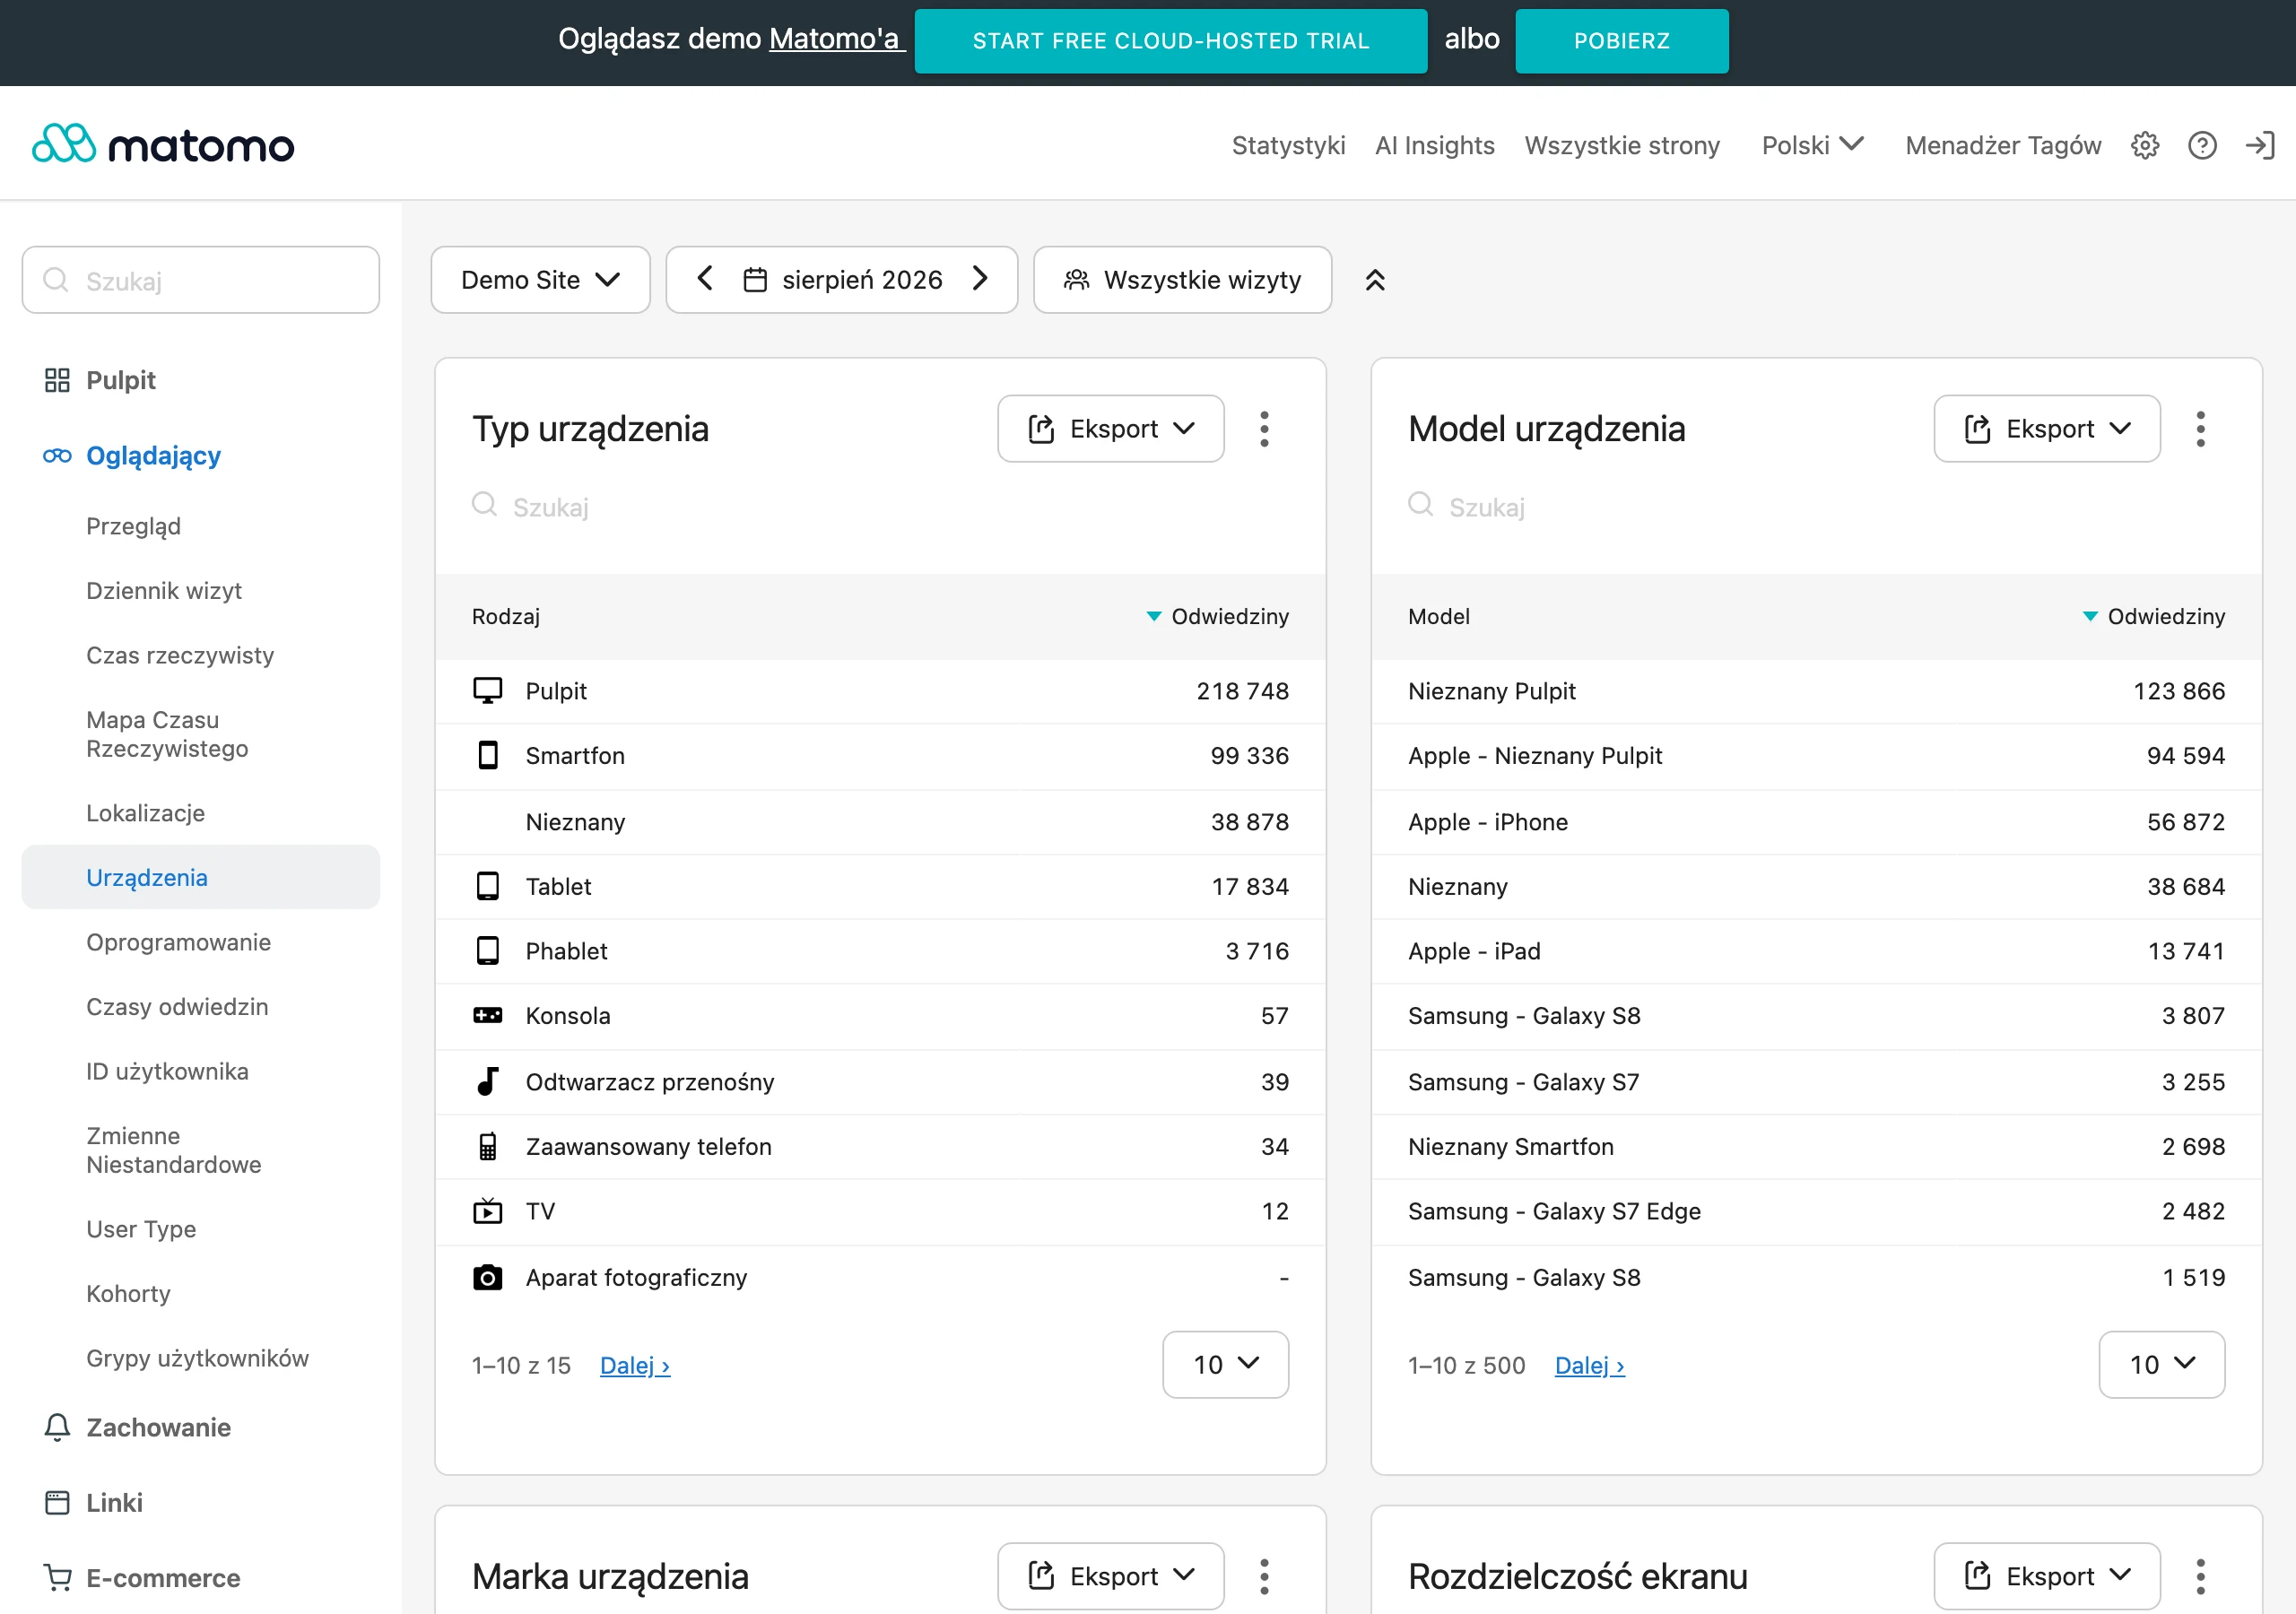
The most value comes from analysis that does not stop at a single average for the whole site. It is worth breaking the data down by acquisition channels, devices, page types, new and returning users, and specific landing pages. This kind of split quickly shows whether the problem affects, for example, only paid campaign traffic, only mobile, or just a few key entry pages.
How to effectively reduce bounce rate step by step
Effective reduction of bounce rate starts with making sure you are calculating it correctly in the first place. If analytics is set up badly, the whole subsequent interpretation will be off. That is why, at the outset, it is worth verifying the bounce definition in the tool you use, the correctness of events, any tag duplication and whether bot traffic or missing analytics consent are distorting the reports. Fix measurement first, then assess the site.
The next stage is data segmentation, because the average for the entire site rarely gives the full picture. The most insight comes from breaking it down by acquisition channels, devices, page types and specific landing pages. In practice, it is best to start with entry pages with high traffic that genuinely translate into sales, leads or contact. That is where improvement usually gives the biggest leverage.
Next, you need to assess how well the user intent matches what people see after landing on the page. If an advert, search result or link promises a specific value, the user should see it immediately, without guessing or scrolling through several screens. Very often the source of bounces is not a bad page in itself, but weak “message match” between the entry point and the landing page.
At the landing page level itself, it is worth analysing the first screen, heading, content layout, offer visibility, CTA and trust-building elements. The user should understand within a few moments where they have landed, what they gain and what the next step is. When they see clutter, several competing messages or an overly generic proposition at the start, they often close the page without any further interaction.
At the same time, you need to check technical issues, especially on phones. Slow loading, a “jumping” layout, non-working buttons, intrusive pop-ups and awkward forms can increase the bounce rate even when the offer is well matched. Mobile issues are one of the most common causes of high bounce rates on entry pages.
Finally, it is worth remembering that the metric itself is not enough. Changes need to be assessed together with other metrics: transitions to subsequent subpages, clicks, scrolling, engagement and conversions. If the bounce rate falls but no valuable actions increase, you are improving the report, not the business result. The right direction is not a lower rate at any cost, but a better quality of visit.
The most important practices in landing page optimisation
In landing page optimisation, the key is to show real value quickly and make it easy for the user to move to the next step. The landing page should “perform” from the first few seconds, because that is when the decision is made whether the user stays or leaves. That is why you first organise the message, and only then refine the visual details.
Most mistakes, and at the same time the greatest potential for improvement, are usually hidden in the first screen. The user should immediately see that the content addresses their need and leads them on. In practice, it is worth checking above all:
- whether the heading clearly says what you offer,
- whether underneath the heading there is a concrete benefit or solution to the problem,
- whether there is one main CTA rather than several competing actions,
- whether the key information is visible without long scrolling,
- whether nothing distracts from the page’s main goal more than necessary.
It is equally important to reduce friction in the rest of the journey. If the user is meant to go to the offer, form, pricing or contact page, the route there should be short and clear. Too many fields, unclear steps or a lack of information about what happens after clicking quickly increase the number of exits.
A good landing page does not end with one button. It is worth adding logical paths for people who are not ready to make an immediate decision, for example an FAQ, a comparison of options, a link to service details or a section with answers to the most common concerns. Not every user converts straight away, but they should be able to find a sensible next step with ease.
Trust is a separate issue. On service and sales pages, a lack of credibility in the data often simply looks like a bounce. Concrete information about the offer, clearly described terms, visible contact details, a clear layout and elements confirming that there is a real company behind the page, not an anonymous form, all help here.
You also cannot separate page optimisation from traffic quality. When a campaign attracts people outside the right audience, or an advert promises more than the landing page actually delivers, adjusting the layout alone will not solve the problem. In that case, you also need to refine ad targeting, keywords, ad copy and landing pages.
Finally, keep in mind that a high value of the metric does not always mean the page needs rebuilding. Sometimes users land, quickly find the answer and leave, and that can still be the correct fulfilment of the goal. Optimise the landing page for real engagement and conversion, not for the look of the report alone.
Analysing user intent as the key to improving results
Analysing intent lets you check whether the page really answers the reason for the visit. The user compares the promise from the advert, search result or link with what they see in the first few seconds after opening the page. When the message does not match, they often leave without any further interaction. A high bounce rate very often does not mean a weak page, but a poor fit between the entry intent and the landing page content.
In practice, it is worth starting with a simple question: what was the user looking for at that moment. Sometimes they are interested in price, sometimes a specific service, sometimes a comparison of options, and sometimes only a quick answer. A page that serves up generalities when the user expects something specific usually loses on the first screen.
The clearest way to see this is to analyse landing pages separately for each source. The same URL may perform well for branded traffic, and worse for paid campaigns or generic SEO queries. Do not assess intent at site level, only at the level of a specific entry point: source, message, landing page.
When assessing fit, the headline, above-the-fold content, information hierarchy and main call to action matter most. The user should immediately see that they are in the right place, what they will get here and what they can do next. If they have to scroll, infer the offer or look for a button, bounce rates rise even with a good product.
It is also worth distinguishing a bad response from a fast response. On a contact page, a simple article with one piece of information or a subpage with opening hours, the user may end the visit quickly and still achieve their goal. That is why you should always assess intent together with the page goal, not just through the metric itself.
If you want to improve results in a meaningful way, align the landing page content with the most common user needs. Often it is enough to make the headline more specific, show the price earlier or the scope of the service, add an FAQ, an options comparison or highlight the next step more clearly. This set of changes usually delivers a better result than a broad rebuild of the entire page.
The role of traffic quality in campaigns and the bounce rate
The quality of traffic from campaigns directly affects the bounce rate, because poorly matched audiences leave the page even when the page itself works correctly. When a campaign attracts people with the wrong intent, a high result is a natural consequence. In such a situation, simply polishing the landing page brings limited results. A good page will not fix traffic that had no chance of converting from the start.
Most often, the problem turns out to be targeting that is too broad, or an ad promise that does not match what the user sees on the page. This applies to broad keywords, overly general audience segments, misaligned creatives and campaigns set to the wrong stage of the buying decision. The user clicks because the message sounds appealing, and after landing they reach an offer that is not for them.
In practice, it is a good idea to compare results not only across channels, but also across campaigns, ad groups, creatives and devices. If a high bounce rate appears in only one source, the cause most often lies in traffic quality or in the ad promise. If the same landing page performs poorly almost everywhere, the page itself plays the bigger role.
Assessing traffic quality should be based on several signals at once: bounces, engagement, visits to further subpages and conversions. A low bounce rate alone does not prove good quality, because it can be the result of improperly configured events or accidental clicks on the site. Look at whether the user takes a meaningful next step, not just whether the session has stopped being counted as a bounce.
In paid campaigns, aligning the message with the stage of the decision becomes especially important. An ad aimed at people who are only just getting familiar with the topic should not immediately lead to a page that requires a quick purchase or filling in a lengthy form. It is more sensible to send such traffic to a page that explains the offer, resolves basic doubts and only then leads to the next step.
If you want to lower bounces from campaigns, start by reducing irrelevant clicks. Check keywords, exclusions, locations, devices, audience segments and ad copy. Sometimes the biggest improvement comes not from changing the page, but from cutting out traffic that was low quality from the outset.
The most common mistakes and pitfalls in interpreting the bounce rate
The most common mistake is treating the bounce rate as a simple assessment of page quality. A high result alone does not yet determine whether the problem lies in the content, the traffic source, the measurement method or the user’s intent. This metric is a signal for diagnosis, not a ready-made conclusion. If you base your assessment on one number only, it is easy to improve an area that is not responsible for the drop in results at all.
A frequent pitfall is also comparing data calculated according to different rules. Changing the analytics tool, event configuration, cookie consent or tag implementation can noticeably shift the result without any real change on the site. Do not compare the metric between systems or periods after a measurement change until you have confirmed the same definition of a bounce.
The second big mistake is analysing the average for the entire site. Such an averaged result throws different page types, traffic sources, devices and user groups into one pot, which usually obscures the core of the problem. In practice, what matters is the breakdown by landing pages, acquisition channels, mobile and desktop, and new and returning users. Only segmentation shows where bounces are actually damaging business results.
Many people also assume that a high bounce rate always needs to be reduced. That assumption can be wrong, because on a contact page, with a short FAQ answer or in an article solving a specific problem, the user may end the visit after achieving their goal. In such a setup, what matters more than the bounce itself is whether the user found the information quickly and without frustration.
A separate pitfall is artificially “improving” the metric by adding excessive analytics events. The report may look better, but user behaviour remains unchanged, and optimisation decisions are based on distorted data. If the events do not represent real engagement, a lower bounce rate is just cosmetic work in the reports.
Wrong conclusions often also come from ignoring traffic quality. A campaign can bring in users who click out of curiosity, because of overly broad targeting or misleading messaging, and then the source of the problem lies outside the page. In such a situation, refining the headline or CTA will usually deliver less than adjusting keywords, ad creative or audience segments.
In the end, it is worth being careful about reacting too quickly to individual spikes in the metric. A small data sample, seasonality, a short-term increase in traffic from one channel, bot traffic or technical issues can temporarily distort the reading. The safest approach is to assess changes in the bounce rate alongside conversions, engagement and moves to the next steps. Only this kind of set-up shows whether the situation is actually improving, or whether only the way traffic is being counted is changing.
FAQ
Frequently asked questions
How should bounce rate be understood in practice?
It is the percentage of visits that end without another valuable interaction with the site. The result alone does not say why the user left, so it needs to be analysed in the context of the page’s goal and the traffic source.
Does a high bounce rate always mean a problem on the site?
No, because on some subpages users may quickly find the information they need and end the visit. On sales pages, a high result is more often a warning sign than on pages with a simple answer or contact details.
Why does bounce rate depend on the analytics tool?
Because different systems define engagement and a bounced session differently. Events, tag configuration, analytics consent and possible measurement errors also matter.
How can you lower bounce rate step by step?
First, check whether measurement is working correctly, and only then assess the page. Next, segment the data, improve the content fit to user intent and remove technical issues, especially on mobile.
What affects bounces on landing pages the most?
The first screen, heading, content layout, CTA and page load speed usually matter most. Communication clutter, intrusive pop-ups and broken elements on phones are also significant.
How does traffic quality from campaigns affect bounce rate?
If an ad attracts the wrong people or promises something different from the landing page, bounces increase. In that case it is worth checking keywords, audiences, creatives and message fit to the stage of the decision process.