
The impact of social media on traffic and leads is measured only once you connect data from links, the website, forms, ad campaigns and CRM into one coherent setup. Reach and clicks on their own are tempting. But the problem is that they do not tell you whether social media are delivering anything commercially. In practice, you need to check which posts, ads and formats are actually bringing users to the site, and then which of those visits end in contact or a sale. What matters most is not how much traffic social media generate, but what that traffic is like and whether it moves further down the funnel. To make that assessment, you need properly tagged links, sensibly configured analytics and a recorded source for every lead. Without that, it is easy to draw convenient but wrong conclusions and burn budget on activities that look good in the platform dashboard.
What measuring the impact of social media on traffic and leads involves
Measuring the impact of social media on traffic and leads comes down to one thing: identifying what actually delivers. It is not about simply counting clicks, but about tracking the entire user journey: from the post or ad, through the session on the site, to the form, demo booking, phone call or lead recorded in CRM. Only connecting data on visits with lead data shows what really works. The question is: can you join it all up without guessing.
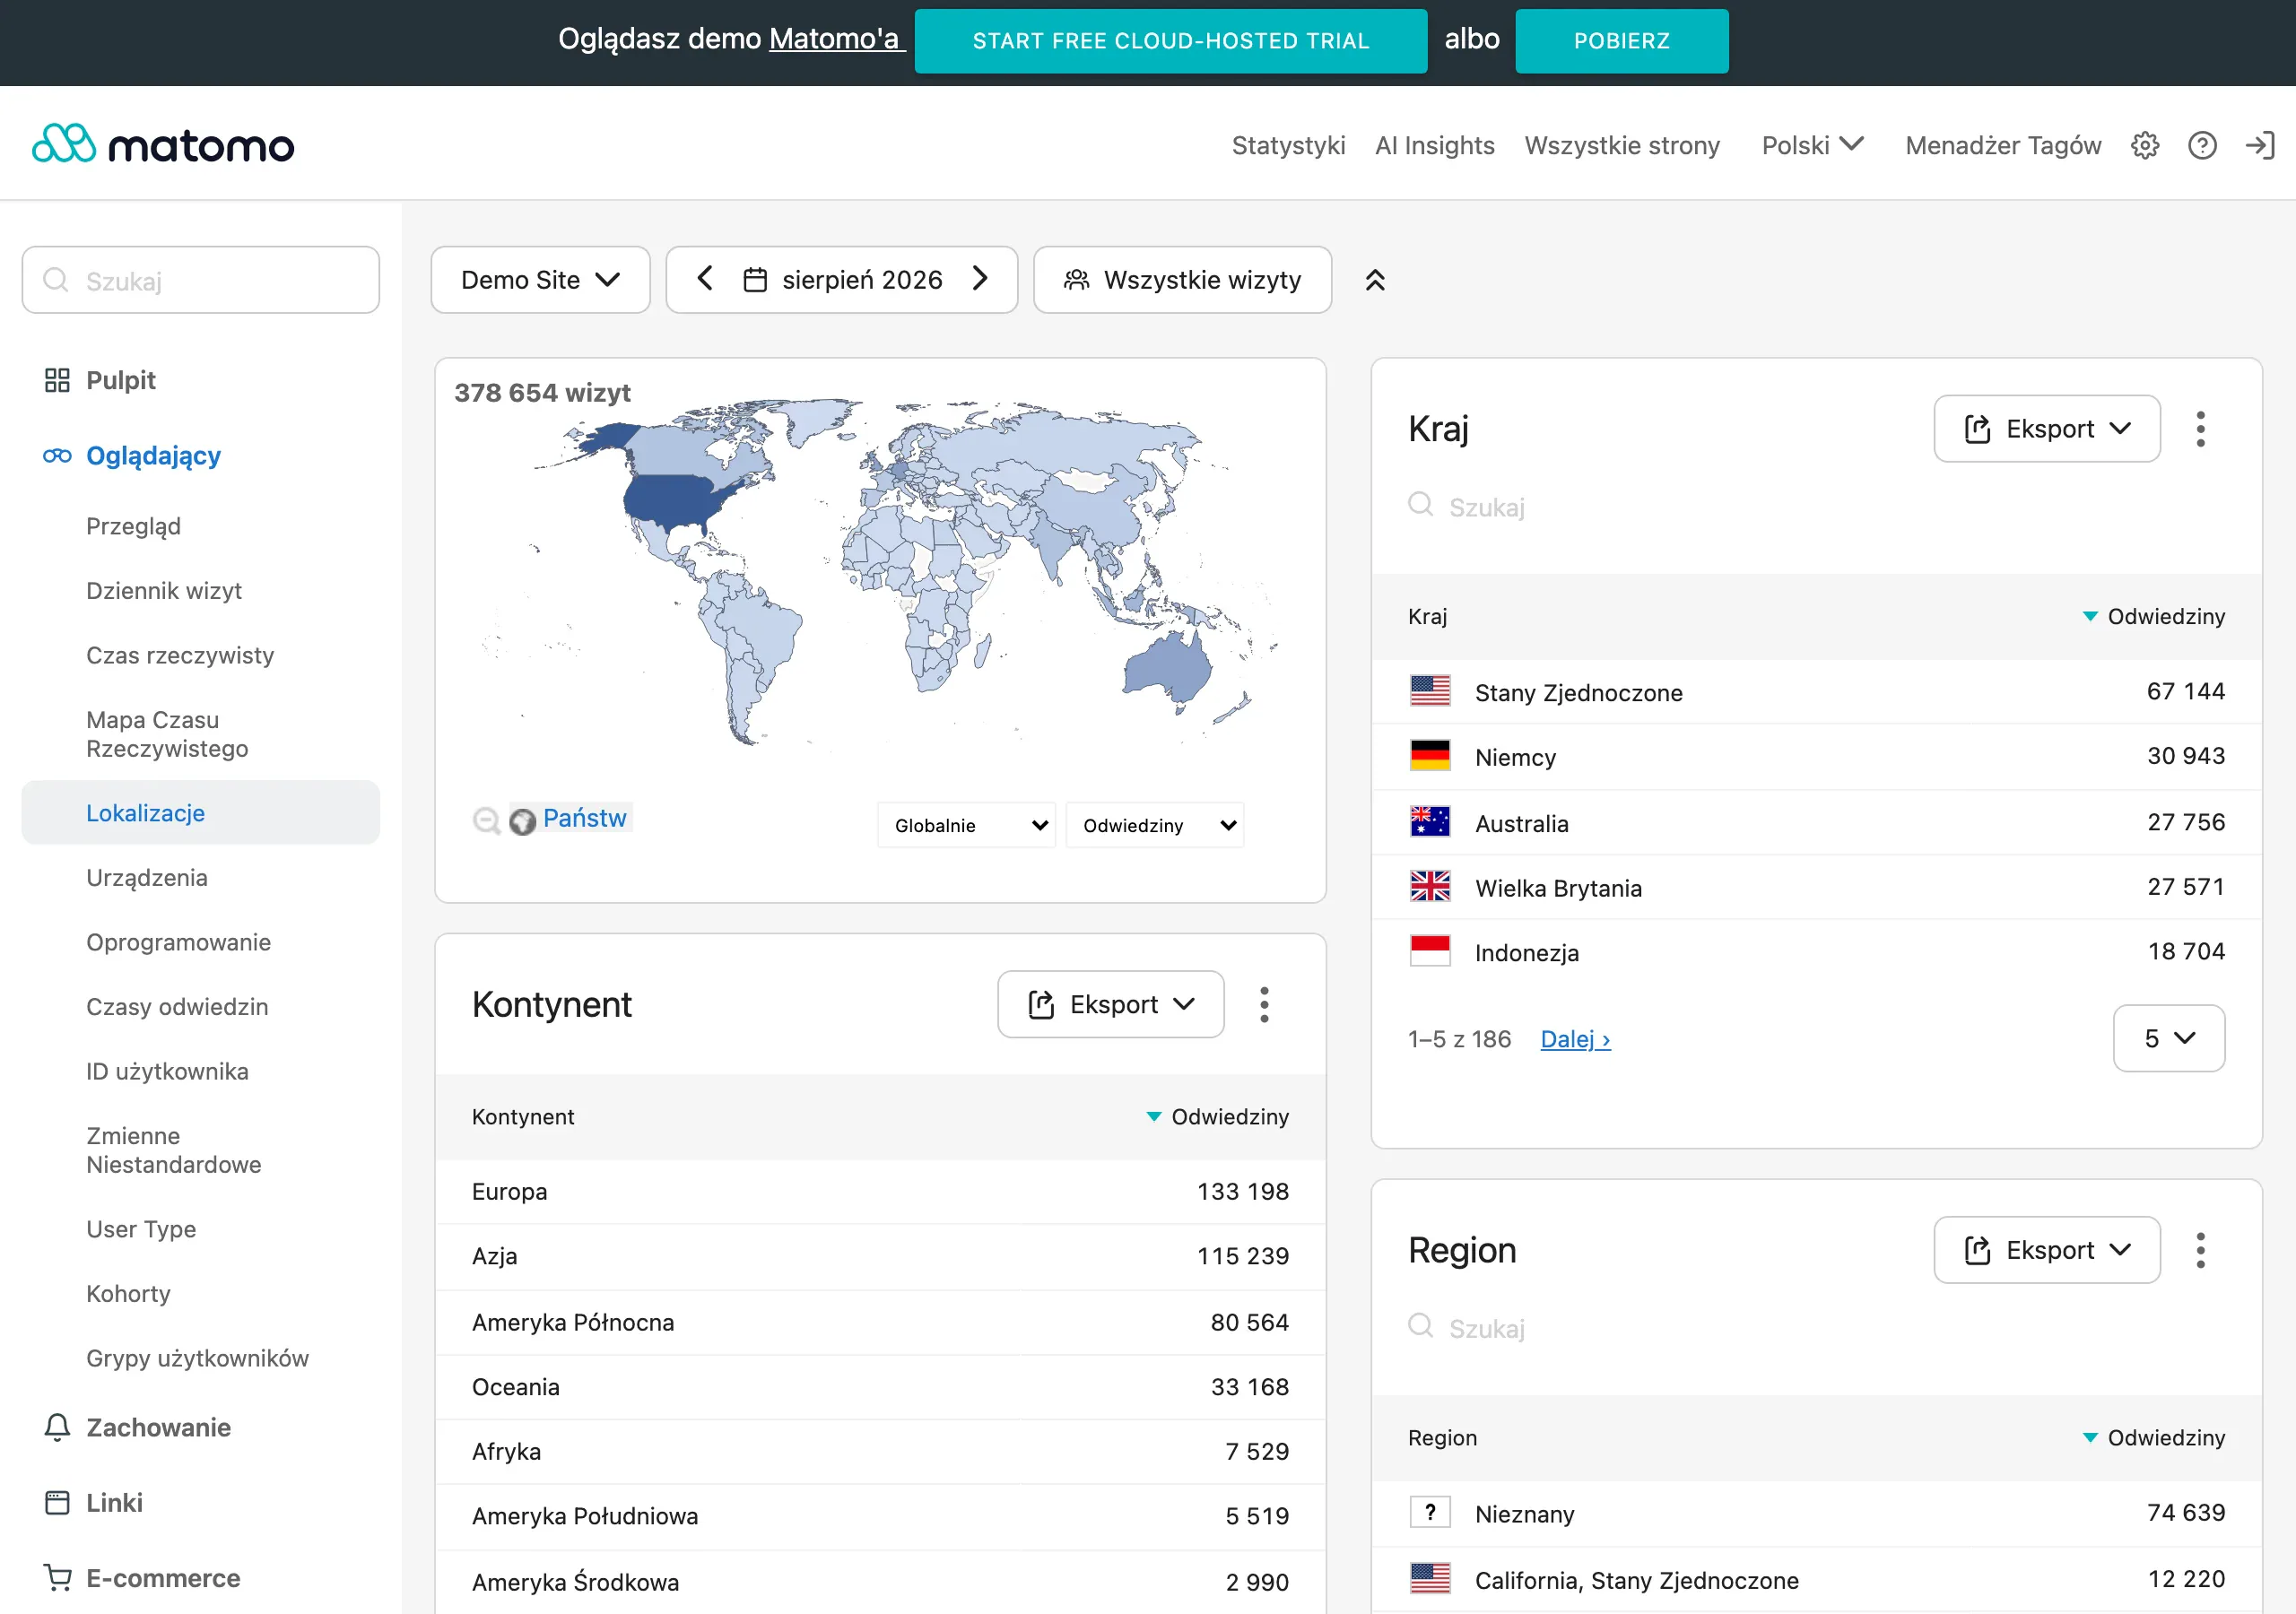
In practice, this kind of measurement requires joining together several data sources. Most often these are social media platforms, the analytics tool on the website, forms, the CRM system and advertising tools. If these systems do not speak the same language, the report will be incomplete and sometimes simply misleading. And then even the best campaign starts to look like a lottery.
The key is one thing: a link tagging standard, usually through UTM. Every link from a post, ad, stories, bio, partner collaboration or remarketing should clearly indicate the source, medium, campaign and ideally also the format or creative. If UTM naming is inconsistent, you cannot reliably compare paid, organic and partner-supported traffic. Instead of data, you end up with chaos. And chaos, as it happens, beats analytics.
Good measurement also needs to separate the roles of different traffic types. Organic traffic is assessed differently from prospecting ads, remarketing, lead ads or influencer visits, because each of these channels works at a different stage of the funnel. Without this, social media are sometimes underestimated, because the user returns later from search or direct, and sometimes overestimated, because the platform attributes the conversion according to its own model. The data make it clear: without separating roles, you are comparing things that cannot be compared.
It is worth measuring not only the final lead, but also what happens after entering the site. Scrolling, clicking a CTA, starting a form, downloading a resource or contact by phone show where the user drops off and what needs improving. This is especially important when there are still few leads and you need to understand whether the problem lies with the campaign, the message or the landing page itself. Look at it another way: if you cannot see micro-conversions, how are you supposed to fix the funnel.
Current context and challenges in measuring social media
Measuring social media is becoming increasingly difficult. Data is being trimmed by privacy, cookie blocking, in-app browsers and different conversion attribution models, so the picture is never exactly “the same”. As a result, the same campaign can look different in Meta, different in GA4, and different again in CRM. And that does not necessarily mean there is an error. The problem is that without a clear division of data roles, we quickly start comparing incomparable things as if they were a single number.
Most often, the friction comes from the difference between advertising platform data and website analytics. Platforms show performance according to their own attribution windows and often assign a conversion after the ad is merely viewed, not only after a click. Web analytics is more “down to earth” here. It describes better what the user actually did on the site, which is why, when assessing the quality of traffic and leads, it is usually simply more useful than the ad dashboard alone.
A separate challenge remains so-called dark social and the loss of some source data for visits. A user may click a link in a messenger app, mobile app, shortened URL or pass through several redirects, and then the traffic lands in the report as direct or is simply misclassified. The question is: do you really want to measure social by looking at “direct”. That is why UTM tagging is not an add-on, but the foundation of reliable measurement.
Multi-channel analysis is also becoming more and more important. Social media often only sparks interest, and the user returns later via branded search, email, remarketing or a direct visit. If you look only at last-click conversions, it is easy to treat social as a weak channel. And then comes the surprise, because in reality it builds demand earlier in the journey and “works” before GA4 shows the final result.
In practice, the role of first-party data, that is the company’s own data, is growing. This means properly collected events on the website, passing parameters into the form, saving the source with the lead, and importing sales statuses from the CRM. It sounds technical, but the stakes are business-critical. Without information on which leads were qualified and which entered the pipeline, it is impossible to assess the business quality of traffic from social media.
For organic content, there is another pitfall: confusing reach with business impact. A post may deliver excellent results on the platform, while at the same time failing to bring valuable traffic or purchase intent. Likes do not pay invoices. That is why, alongside reach and engagement, you need to look at clicks, on-site behaviour, micro-conversions and later assisted conversions.
How the process of measuring and attributing leads works
The process of measuring and attributing leads is about tracing the user journey from clicking a post or advert to saving the lead in the CRM and assigning it a sales status. In practice, it starts with a data audit, that is checking social media accounts, ad managers, website analytics, the tag manager, forms and the CRM, step by step. This is exactly where problems come to light: inconsistent UTMs, missing events or no source saved with the lead. But note, there is no room for guesswork here. If the source is not saved in the form and CRM, the impact of social media on the business cannot be assessed reliably.
The next step is simple: decide what you call a conversion and what the funnel looks like. The key is to separate micro-conversions, such as a CTA click, scroll or form start, from proper leads, for example form submission, demo booking or a sales enquiry. This makes a difference, because social media rarely closes a sale immediately, but it strongly pushes the audience through the earlier stages of the decision.
Then comes the measurement plan and naming convention. Every link should clearly indicate the source, medium, campaign, format and often also the creative or message, without having to guess along the way. The greatest order comes from one UTM dictionary and one campaign naming convention used by the whole team, with no exceptions or manual variations. This makes it possible to compare the results of organic posts, ads, remarketing, partner collaborations or bio links in a single report, rather than in several versions of the same truth.
From the technical side, events, parameters and integrations are implemented. Usually this means configuring GA4, Google Tag Manager, ad pixels, conversion events and passing UTM parameters into the form and then into the CRM. But note, everything looks beautiful on paper. In practice, you need to check whether a click from a mobile app actually saves the correct source/medium and whether the data does not get lost after redirects.
Data validation is a separate stage, not decoration after implementation. You compare the consistency of sessions, events and leads across systems, catch duplicates and check whether the report shows the same thing for different entry paths. It is worth treating ad platform reports as a source of media data, and website analytics and CRM as a source for assessing traffic and lead quality. The fact is that these two worlds can speak different dialects about the same user.
Lead attribution itself is not about giving the entire result to the last click. Many conversions start with a post or advert in social media, and finish later through a branded visit, email, direct or remarketing. Instead of looking only at the finish, it is better to analyse assisted conversions, time to conversion and the channel’s share in the whole path. Only then can you see who is really driving the result and who is just appearing at the finish line.
Finally, you close the loop with the CRM and sales. It is worth importing into analytics information on whether the lead was qualified, rejected, converted into a sales opportunity or a customer. Only after combining cost data with lead quality data can you see which campaigns are really working and which are only generating forms. And that is not a cliché, but a condition for sensible optimisation.
What to analyse and optimise in social media campaigns
In social media campaigns, you need to manage the whole funnel: from website visits to lead quality and its further fate in the CRM. CTR, reach or the number of forms are not enough, because they can look great with a terrible traffic match. The best decisions are made only when cost, on-site behaviour and business outcome sit side by side. Without that, optimisation is sometimes like turning knobs in the dark.
The most practical analysis structure is simply the sequence of funnel stages:
- clicks and sessions broken down by paid traffic, organic, remarketing and other sources,
- behaviour after entry: engagement, scroll, CTA clicks, bounces, time to interaction,
- form progression: start, abandonment, submission,
- lead status in the CRM: qualification, rejection, pipeline, sale.
Segment results ruthlessly. At minimum by platform, campaign type, format and landing page, otherwise you put traffic with completely different intent into one bucket, for example remarketing with prospecting or lead ads with a campaign directing users to the website. Putting everything into one table almost always ends in incorrect conclusions about effectiveness.
A landing page can “make” or kill leads. When the promise from the ad does not match the headline, the form drags on like a soap opera, and the CTA disappears on the screen, the campaign loses performance regardless of targeting quality. And here is the paradoxical truth: often refining the landing page delivers a bigger effect than another creative change.
Too few leads. And it goes blind.
That is exactly when going deeper is key: micro-conversions and assisted paths. Social media often warms up interest earlier, and the user returns only later from another channel. If you count only the leads attributed to the last click, it is easy to understate the real impact of upper-funnel content and campaigns.
In organic activities, separate two things: reach and click. A post may gather great engagement on the platform, while at the same time adding nothing to website traffic or to lead generation. It is better to check which topics and formats attract users who come back, go further through the site and ultimately leave their details more often.
In paid campaigns, do not stop at CPC. The data clearly shows that a more meaningful picture comes from the cost of a qualified lead, the bounce rate after entry, the form completion rate and the campaign’s share in the pipeline. This set of metrics shows faster whether the problem lies in targeting, creative, offer or simply the landing page.
Most mistakes are born out of chaos. Inconsistent campaign names, different source/medium variants, no tests of mobile links and no single definition of a valuable lead can throw any report off course. When data from ad dashboards and analytics differ, the problem is that people look for “the one truth” instead of assigning roles to the tools. The ad dashboard answers the question of delivery and clicks, while website analytics and the CRM answer the question of traffic quality and business impact.
Using UTM parameters to track campaign performance
UTM parameters are there to assign every visit and every lead to a specific source, campaign, format and message. In social media, this is essential, because traffic from apps can “lose” correct referrer data and, without tagging, end up as direct or as unclear sources. If a link does not have the correct UTM parameters, after a few days you will no longer be able to reliably reconstruct where the lead came from. And this applies not only to ads, but also to organic posts, links in bio, stories, partner collaborations and influencer activities.
In practice, the minimum is simple: consistent use of the source, medium and campaign parameters, and often content as well to distinguish creatives or formats. The point is not for the scheme to balloon with more fields, but for it to be unambiguous and repeatable in every link. The best standard is the one the team always uses, not the most elaborate scheme. Because if you label traffic as facebook one time, fb another time, and meta another, the report loses meaning faster than you can show it to anyone.
Good practice starts with order. And with separating paid from organic already at the medium level, for example paid_social and organic_social. This makes it possible to compare ad campaigns with organic publications fairly, instead of lumping them together and pretending they are the same. The same applies to remarketing, partners, influencers and dark social. Each of these sources should have its own label if you want to see its impact separately, rather than in a blurred average.
Simply attaching UTM parameters to a link does not do the job if the parameters do not travel on to the form and CRM. A user may come in from an ad, return later via another channel and submit the form only after a few days. The problem is that, without recording it, you lose the context, and context is currency in marketing. That is why it is crucial to record both the first and the last contact source. UTM parameters must be saved not only in analytics, but also with the lead itself in the CRM. Only then is it possible to assess which campaigns generate not only traffic, but also valuable contacts.
UTM parameters are also useful where real optimisation begins. Not at channel level, but at content and creative level. You can check whether a specific video, carousel, lead magnet, sales message or educational topic works better. And this is not a cliché: it is precisely this level of detail that provides the fuel for cuts and budget shifts, for creative changes and for improving the landing page. Instead of being satisfied with the slogan that “Facebook generated traffic”, you get an answer to what exactly delivered the result.
The most common mistakes and barriers in measuring effectiveness
The facts are these: most mistakes in measuring effectiveness come from inconsistent naming, tracking gaps and a lack of connection between the data and the CRM. Most problems do not come from analytics itself, but from the fact that different people publish links according to their own rules, each “their own way”. Most mistakes come from the lack of a single standard, not from the technology itself. As a result, the report shows plenty of traffic, but does not answer the simplest question: which activities really deliver leads.
A very common mistake is mixing paid and organic traffic or omitting some publications from tagging. Then some visits end up as direct, referral or in generic social, which means campaign results can be both underreported and overstated, depending on where in the report you look. But note, that is only the beginning. The problem is compounded by redirects, link shorteners, links opened in mobile apps and forms that do not save source parameters, so the user journey falls apart in the final stretch.
The second group of problems is poorly configured events and conversions. When a form triggers several events, the pixel counts duplicates, or GA4 does not distinguish between form start and form submission, you end up guessing at which stage of the funnel the user really drops off. The result can be misleading. In the ad dashboard, the campaign looks “healthy”, but in practice it delivers poor traffic or leads of a quality that sales do not want to touch.
Another common barrier is reading the differences between systems incorrectly. Ad platform reports show results according to their own attribution and their own conversion windows, while website analytics describe what the user does after arriving. The problem is that people try to force these worlds to “agree” on a single number. Why, if they are different measures? Platforms are there to assess delivery and costs, while the website and CRM are there to assess traffic quality and business impact.
The most difficult obstacle is often organisational, not technical. One shortfall is enough: there is no data owner, there is no shared definition of a quality lead, there is no process for passing sales statuses back to marketing. And then optimisation ends at cost per click or cost per form fill, because nothing better “comes back” into the reports. Without a shared definition of a valuable lead, you can optimise campaigns towards forms that have no sales value. So the question is not “are we measuring”, but “are we all measuring the same thing”, because measurement only works when marketing, analytics and sales are operating with the same definitions and the same source vocabulary.
These barriers can be reduced. You need to start with order, not fireworks: one UTM dictionary, one measurement plan, one event map and a test of every important link before publishing. Then comes the routine, which is something nobody wants to see on slides. Check regularly whether the source is recorded in the form, whether the lead reaches the CRM without duplication and whether the sales status returns to the report. It is less spectacular than a new campaign, but note: this is the process that decides whether the data are fit for decision-making.
Final reports and analysis of social media impact on sales
Final reports and analysis of the impact of social media on sales should show which activities actually deliver not only traffic and forms, but also qualified leads, sales opportunities and revenue. Without that, we are left with a theatre of metrics. A good report ties together data from ad platforms, website analytics, forms and CRM into one path: from click to sales status. This makes it clear whether a campaign generates cheap traffic with no value, or whether it genuinely feeds the pipeline. The most important thing is not the cost per click or the sheer number of leads, but lead quality by source and their subsequent fate in sales.
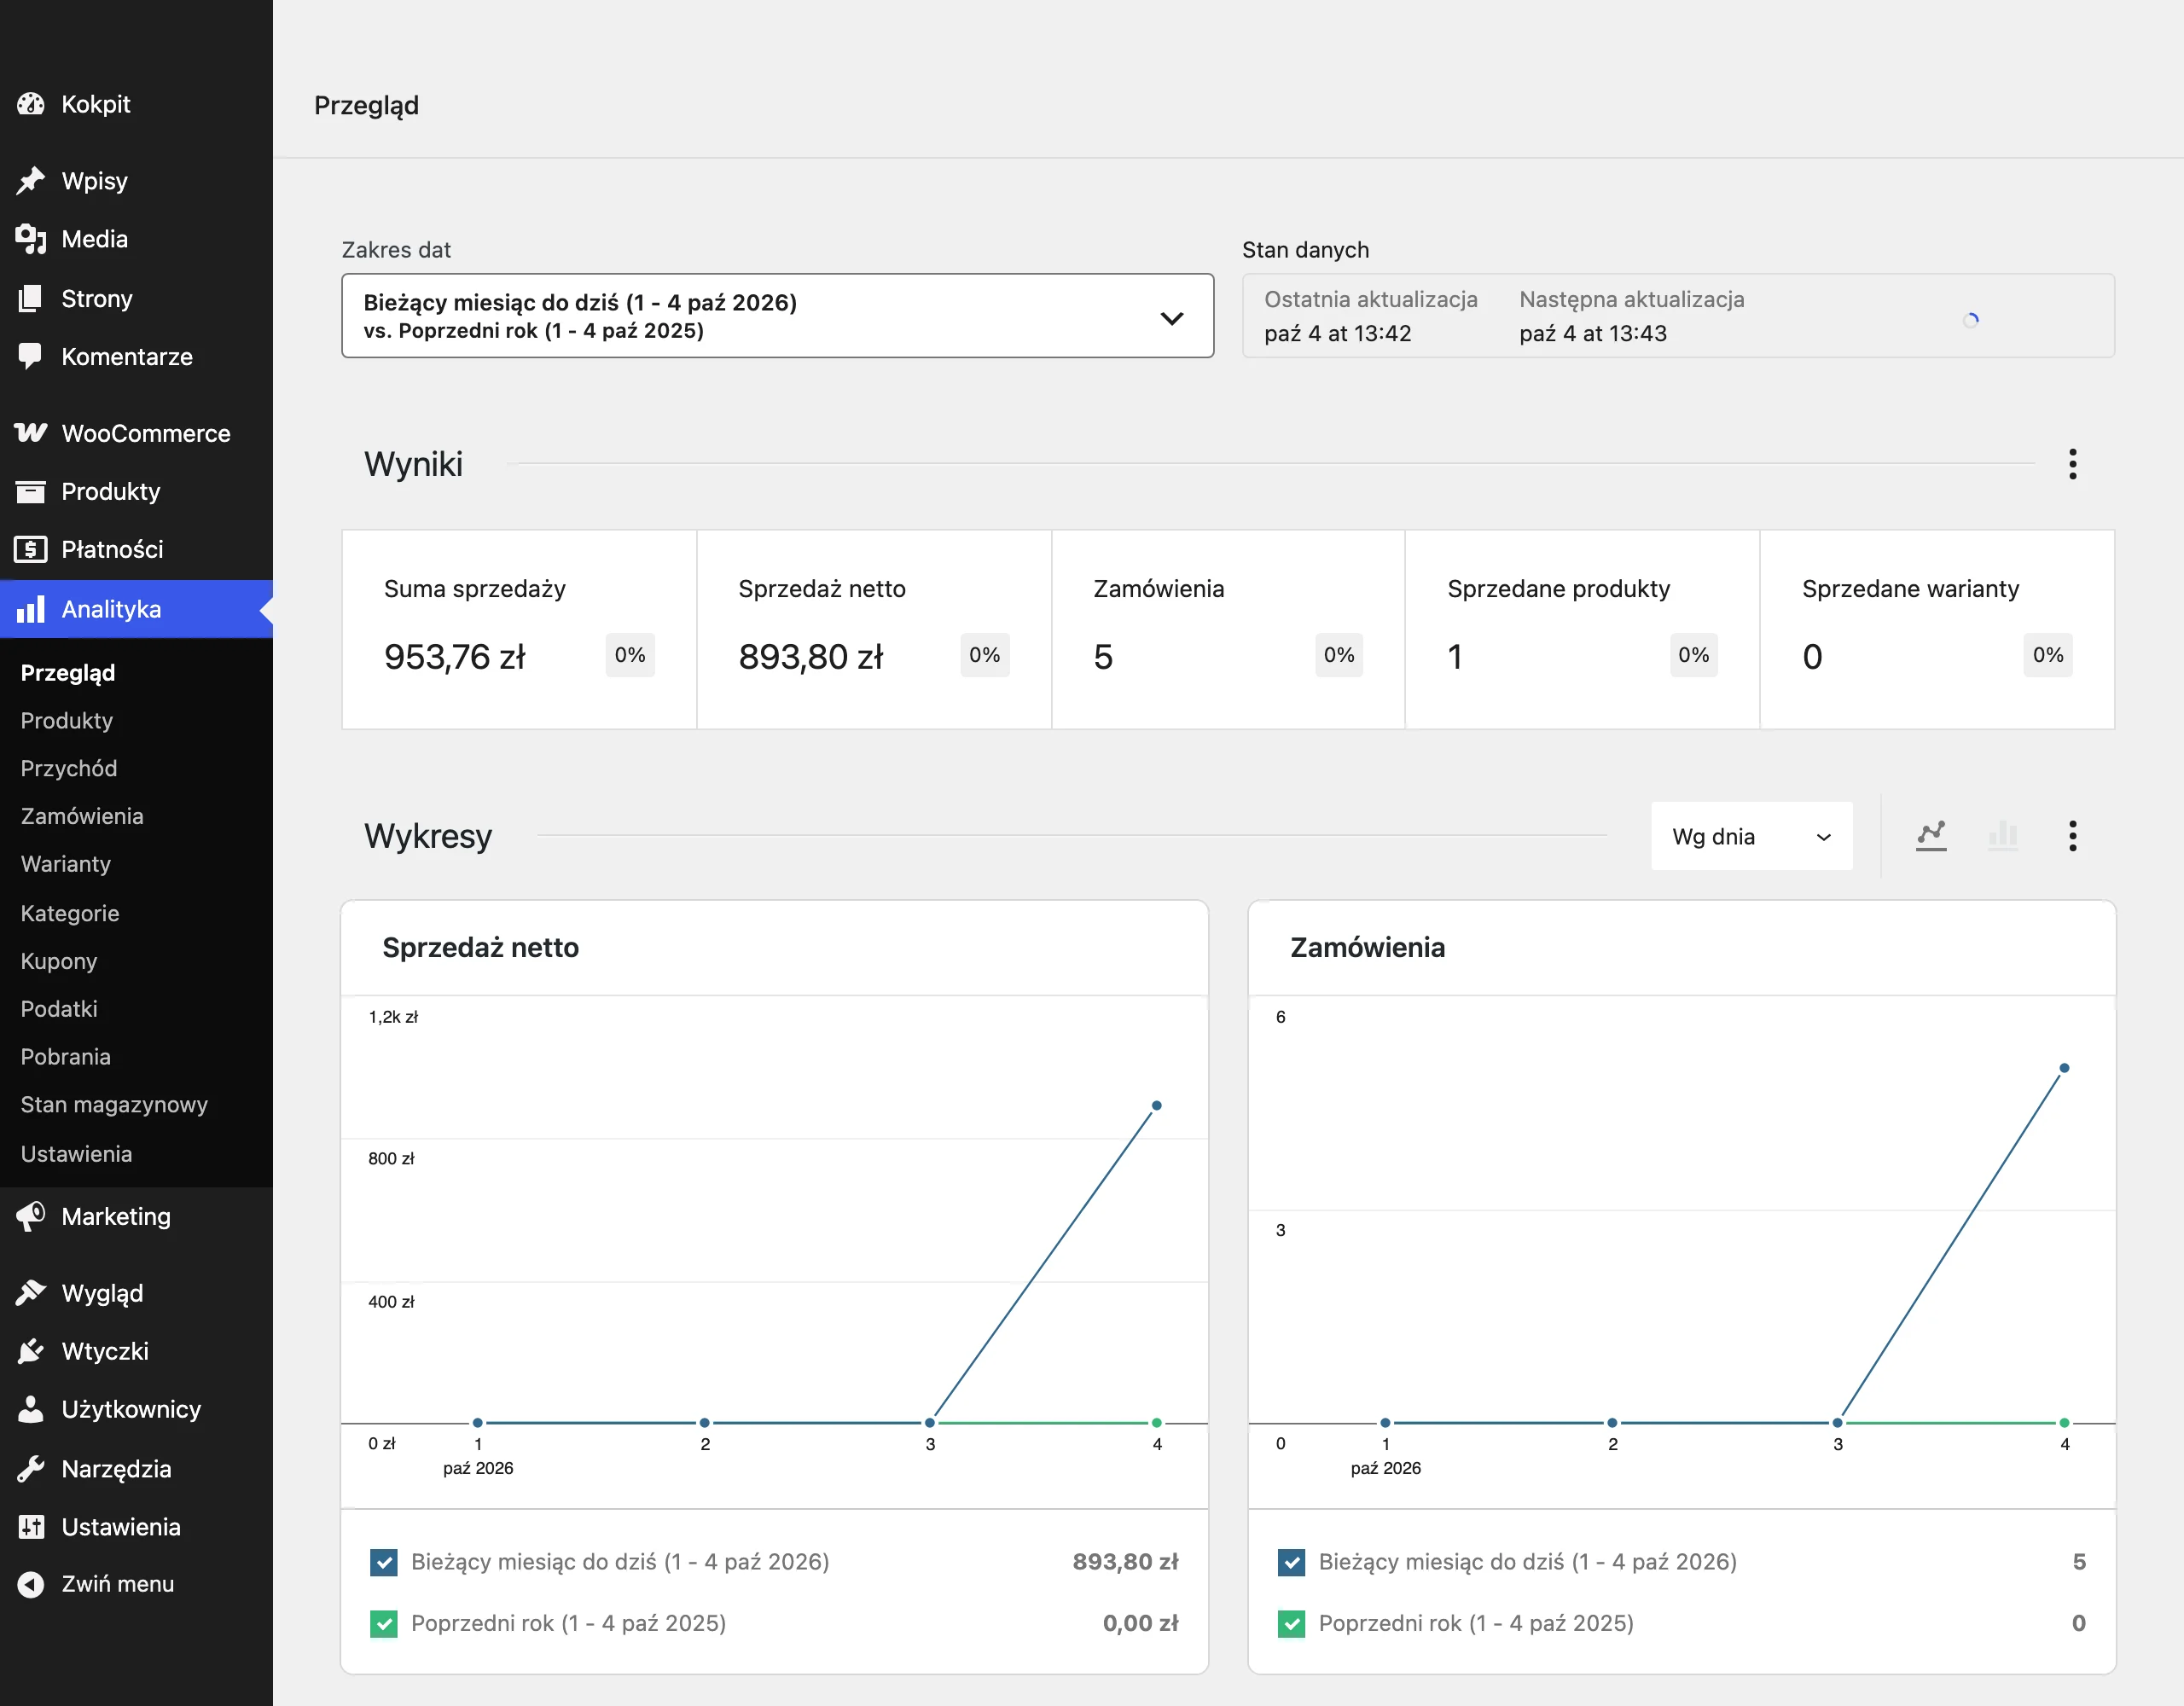
The final report should be structured in layers, not as a single table with random metrics. First traffic sources and costs, then on-site behaviour, then the number of leads, and finally their quality and sales outcome. It sounds simple. And that is good, because this structure lets you quickly identify where the campaign is losing effectiveness: at the click, on the landing page, in the form, or only at the qualification stage by salespeople.
- traffic broken down by platform, campaign, format, creative and landing page,
- sessions, engagement, micro-conversions and form starts,
- the number of leads, cost per lead and form completion rate,
- the number of qualified leads, share in the pipeline and statuses from CRM,
- time to conversion, assisted conversions and closed sales by source.
Without CRM, the loop does not close. Analysis of impact on sales requires linking in CRM data so that statuses such as: unqualified contact, MQL, SQL, sales opportunity, won or lost come back into the report. Only then is it possible to assess honestly whether social media deliver valuable contacts, or merely inflate form volume. If the source is not recorded against the lead in CRM, sales analysis becomes guesswork.
In practice, assisted and delayed conversions also matter. Social media often open the journey, and the user later returns via branded search, direct or email and only then submits the form. Who gets the credit in a last click model in such a setup. That is exactly why evaluation based solely on last click usually underestimates the role of social media, especially in a longer decision-making process. If a campaign generates good traffic and plenty of micro-conversions but has few direct conversions, you need to check its contribution to sales assistance rather than switch it off straight away.
Differences between data from social platforms, website analytics and CRM are normal. The problem is that you need to read them in the right order rather than mixing everything into one bag. Ad platforms are best at showing delivery, clicks and media cost. Web analytics assesses visits and behaviour after entry better, while CRM shows the business quality of the lead most clearly. For budget decisions it is worth using all three layers at once, but sales performance should be assessed primarily on analytics and CRM data, not just from the ad dashboard.
The report is meant to be a decision-making tool, not an archive of numbers. On its basis you shift budget between platforms, cut weak audience groups, expand effective content topics, simplify forms and improve landing pages. It often turns out that a campaign with a higher cost per click gives a lower cost per qualified lead because it filters audiences better. That is not a paradox, just selection. The most useful report does not answer the question “how many leads were there”, but “which activities are worth scaling, which need fixing, and which should be stopped”.
FAQ
Frequently asked questions
How do you measure the impact of social media on traffic and leads?
You need to connect data from social media, website analytics, forms, ad campaigns and CRM. Only then can you see which activities attract traffic and which visits end in a lead or sale.
Do clicks and reach alone show whether social media are working commercially?
No, because they only show activity in the dashboard, not the business outcome. Real performance is shown only by website visits, micro-conversions and lead records in CRM.
Why are UTMs important when measuring traffic from social media?
Because without them, traffic from apps, stories, bio or partnerships can be wrongly attributed to direct or an unclear source. Consistent UTMs let you reliably compare campaigns, formats and channels.
What is worth measuring besides the number of leads from social media?
It is worth tracking micro-conversions such as scroll depth, CTA clicks, form starts or material downloads. This shows where users drop off and what needs improvement.
When are social media underreported in reports?
When a user returns later via search, direct, email or remarketing, and the conversion is counted only on the last click. Then social often looks weaker than it really is.
How can you check which social media campaigns generate valuable leads?
You need to combine campaign cost with lead quality and their status in CRM, for example qualification, rejection or entering the pipeline. A form counter alone is not enough to assess effectiveness.