
Sales are improved not by the number of data points collected, but by whether they help you make a better decision in the store and marketing. Behavioural and transactional data usually deliver the most value, because they show real intent and actual purchases. That is why, before rolling out more forms, you need to decide which result you want to improve: retention, average basket value or margin. It is equally important to collect data in line with RODO, because too many fields and unclear consents reduce conversion and damage the quality of the database.
Data strategy and business goal: the key to effective data collection
The key to effective data collection is linking every measurement point to a specific business goal. If you want to increase retention, you need data on purchase frequency, date of the last order, returns and preferred categories. If the goal is a higher AOV or margin, information about purchased SKU, discounts used and purchase structure is more valuable.
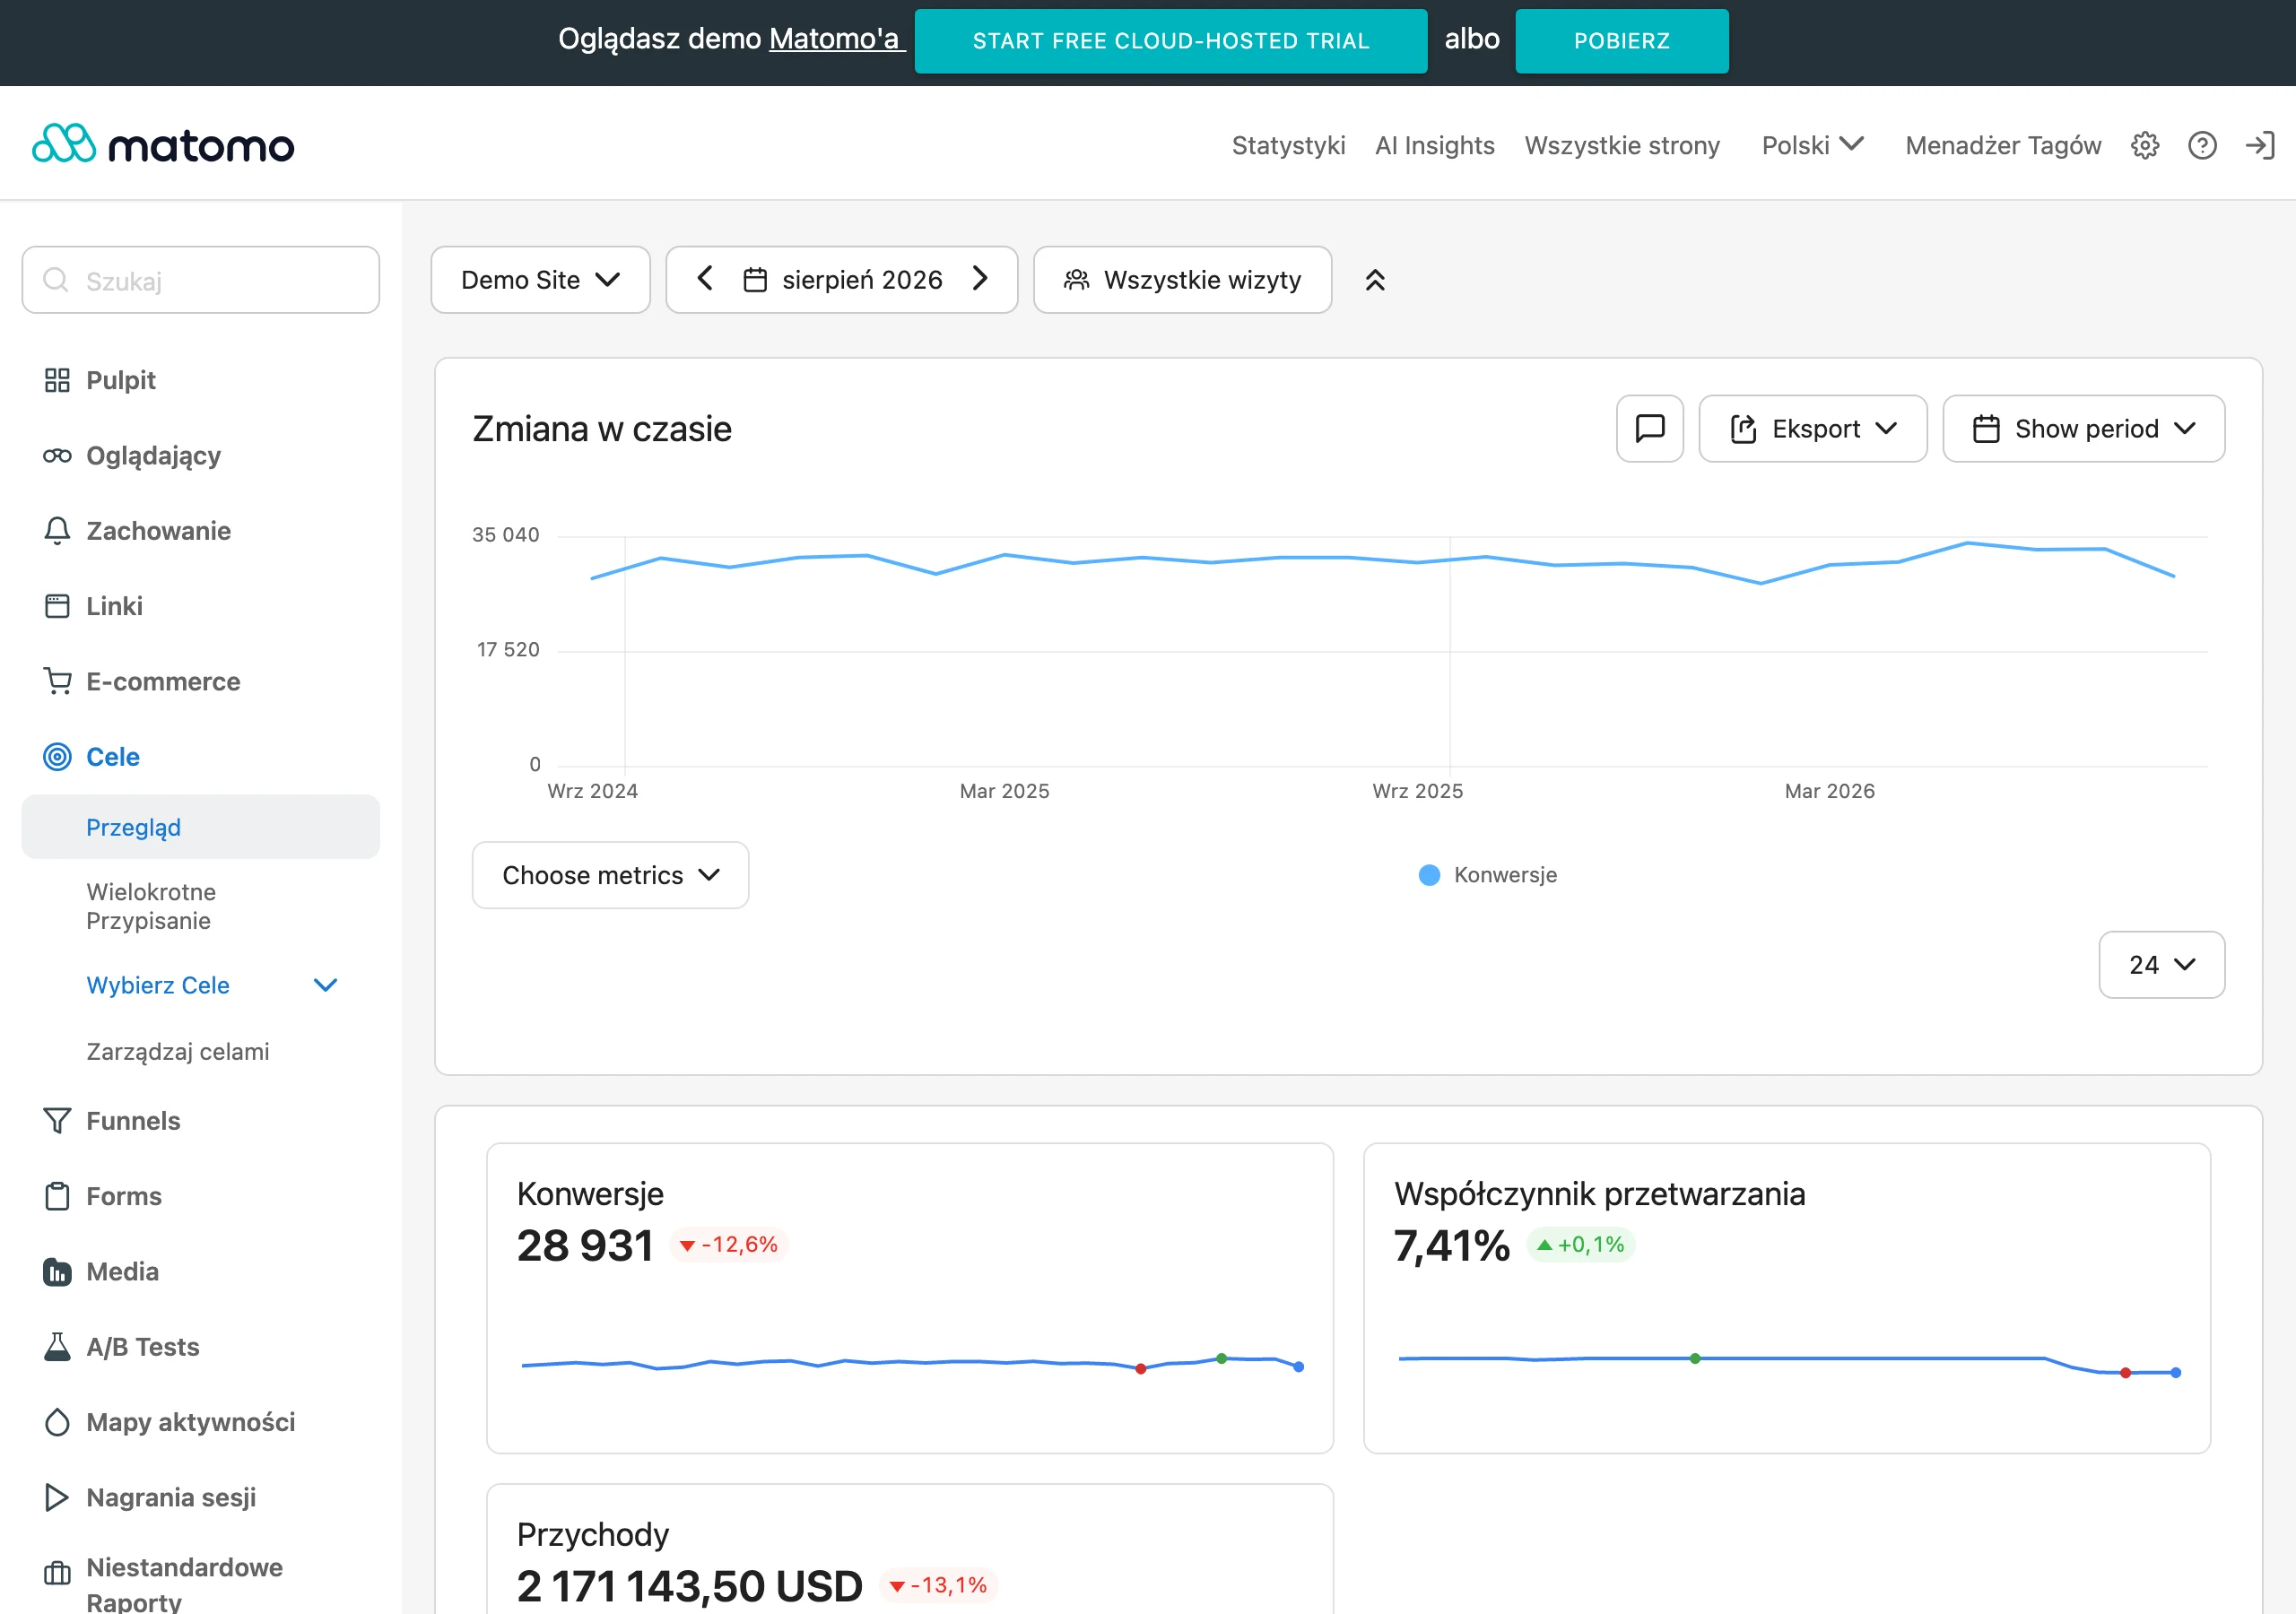
In practice, it is best to start with behavioural and transactional data, because they translate into decisions fastest. The path of viewed products, applied filters, search queries, add-to-cart actions and abandons shows where the customer loses momentum. Order history, in turn, tells you who buys regularly, who returns and which customers generate sales only thanks to discounts. Demographic data alone rarely suffice to improve results if you do not know what the user did and what they actually bought.
The second step is to record which data should trigger a specific action. Without that, it is easy to end up with reports that nobody uses. The example is simple: the date of the last purchase can drive a win-back campaign, while margin data helps assess the profitability of a discount. That is what separates collecting data for sales from collecting data just in case.
Consents and privacy: how to protect customer data in line with RODO
You protect customer data in line with RODO when you collect only the information that is necessary and clearly communicate its purpose. This approach means data minimisation and privacy by design already at the stage of the form, tracking and tool integrations. Every additional field that does not support order fulfilment or a later business decision can reduce conversion. That is why the form should be as short as possible, and the scope of data justified by real use.
The consent must be informed, specific and tailored to how the data will be used. The user should understand whether they agree to analytics, personalisation or advertising activity, and the system must respect that choice. In practice, this means correct measurement configuration and tools compliant with Consent Mode v2. Clear rules increase the credibility of the data, because they limit accidental and ambiguous signals.
The most common mistake is asking for more data than the shop can later sensibly use. Such a database not only converts worse, but also makes analysis harder, because it mixes necessary information with random details. It is better to collect less, but with high consent, good quality and a clear use in sales.
Behavioural data: analysing the customer journey on the site
Behavioural data shows what the customer really does in the shop before buying or leaving. It is this data that reveals intent, the moment of hesitation and the places where the offer or interface fails to deliver. In practice, it is worth measuring viewed products and categories, filters used, search queries, additions and removals from the basket. This is also supplemented by interactions with site elements, such as clicks or scrolling, if they help to understand the purchase decision.
The most useful behaviours are those that can be linked to a concrete improvement in sales. If users often use the size or price filter and rarely buy, the problem may be the assortment, product presentation or availability. If they enter specific queries in the search and do not move on, the shop is losing demand at the navigation level. Internal search queries are especially valuable, because they show the customer’s need in their own words.
Signals from the basket are also highly valuable. Simply adding a product to the basket does not yet mean high purchase readiness, but a sequence of add, remove, add again already says a lot about customer uncertainty. In practice, such data help distinguish a price problem from a trust, delivery or product-fit problem. A abandoned basket should be analysed together with the earlier journey, because otherwise it is difficult to assess whether the user was decided or only comparing options.
You do not need to track everything. It is better to build a simple measurement plan around a few events that answer specific business questions. For a shop with a broad catalogue, the search engine and filters will be key, while for a shop with a small offer, the product and basket journey often matters more. If behavioural data is later to feed segmentation, it must be consistently named and assigned to the same user.
This data is useful beyond sales analytics itself. Search queries and on-site behaviour reveal what customers cannot find in product descriptions, FAQ or category pages. That provides material for content that responds to real intent instead of guessing audience needs. In practice, well-collected behavioural data supports UX, merchandising and content development at the same time.
Transactional data: what does it say about your customers?
Transactional data tells you who buys, what they buy, how often they come back and whether their purchases are profitable. It is the foundation for assessing a customer not through declarations, but through actual orders. The most important elements are purchased SKU and categories, order value, discounts used, purchase frequency, date of the last order and returns. If the shop also analyses margin, it sees not only revenue, but the customer’s real value.
In practice, the number of orders alone is not enough. A customer who buys often, but only with a high discount, may look good in revenue terms and poor in profitability. Conversely, a customer with lower frequency, but with no returns and buying high-margin products, can be more valuable than simple sales reports suggest. That is why order history should be analysed together with discounts, margin and returns.
Two simple signals are very useful: frequency and the date of the last purchase. On their basis, it is easy to distinguish an active customer from one who is starting to drop off. This allows you to launch actions at the right moment instead of sending everyone the same campaigns. Recency and Frequency are practical because they quickly show who to win back and who to develop with complementary offers.
Returns are sales data too, not just operational data. If a customer often returns products from the same category, the problem may concern traffic quality, the product description or product-market fit. The reason for the return helps assess whether you need to improve the product page, information policy or assortment selection. Ignoring this area leads to false conclusions about sales effectiveness.
Transactional data are also the basis for sensible segmentation. Thanks to them, you can separate customers by basket value, discount sensitivity, preferred categories or churn risk. Such a division only matters if it later influences actions, for example recommendations, post-purchase communication or customer win-back. Without that, the shop has a report, but no mechanism for improving the result.
The most common mistake is to assess sales solely through revenue. That is not enough if some orders are returned, require heavy discounts or generate low margin. A better picture is given by data that show the customer’s full result over time. Only then can you see which segments are really worth scaling and which only appear to improve sales.
Behavioural segmentation and RFM: how to create customer groups?
Customer groups are worth creating based on what they do and buy, not just who they are. The most useful segmentation combines behavioural data with transaction history. This way, the shop sees not only interest, but also the customer’s real value. Such a division supports sales better than general labels based solely on demographics.
The RFM model organises customers according to three simple dimensions: the date of the last purchase, frequency and value of purchases. That is enough to separate active customers from those who are beginning to drop off. A customer with high Recency and Frequency usually requires different communication than someone with just one old order. In practice, RFM helps determine the priority of actions, not just name the segment.
Basket value alone does not give the full picture, so segmentation needs to be extended with behaviour and profitability. Preferred categories, discount sensitivity, returns and margin on purchased products are highly important. Only such a set shows which customers are worth developing with an offer and which are not worth acquiring through more expensive traffic. A segment only makes sense if it triggers a different action than in other groups.
In practice, the most useful segments are:
- customers newly acquired after their first purchase,
- regular customers with a high frequency,
- high-margin customers, even with a lower AOV,
- customers who buy mainly with a discount,
- customers with a growing risk of churn,
- customers who often return products in the same category.
Declared data can enrich such a division, but should not be its only foundation. If a customer indicates preferences in their account or answers a product quiz, it is easier to tailor the offer. However, you need to verify whether the declarations match behaviour and purchases. In a shop, what matters is what the customer actually does over time.
The most common mistake is building too many segments at once. If the team cannot assign separate actions to them, segmentation becomes just a report. It is better to start with a few groups that differ in value, intent or churn risk. Such a division is easier to maintain, measure and develop.
Data activation: personalisation and sales optimisation
Data activation means turning segments and behavioural signals into concrete sales actions. Only at this stage do data start to have a real impact on the shop’s result. The point is for the user to see the right product, message or prompt at the right moment. Without that, even good analytics will not improve sales.
Most often, activation works through recommendations, content personalisation, cross-selling, up-selling and basket recovery. If a customer is viewing a specific category, the shop can promote products related to it. If they regularly buy the same type of products, reminders and complementary suggestions make sense. If they abandon their basket after using filters, it is worth simplifying the journey or showing more relevant variants.
Personalisation should not be random. It must stem from data that actually change the purchase decision. Different messages should be sent to a new customer and to someone returning after several orders. It is equally important to distinguish a discount-sensitive person from a customer who responds more to availability, convenience or fit.
Dynamic merchandising also brings great value, meaning changing the order and exposure of products according to user behaviour. If customers from a given source often choose the lower price range, the shop can give more prominence to relevant products already on the category listing. If users often return to the same subcategory, it is worth shortening their path to the offer. This is not interface cosmetic work, but a way to shorten the path to purchase.
Data activation also includes post-purchase communication and win-back actions. A customer after their first order will usually benefit more from a calm introduction to the offer than from an aggressive discount. Conversely, a customer with a long period of inactivity may need a different trigger than someone who was buying regularly just a month ago. A simple logic based on Recency, Frequency and customer value works well here.
The best personalisation simplifies the customer’s choice, rather than just increasing the number of messages. If a shop shows too many poorly matched recommendations, noise grows and site usability drops. That is why it is worth starting with a few high-impact scenarios. Usually these are the product page, basket, search and post-purchase communication.
The impact of activation should be assessed through business metrics, not just clicks. In practice, the most important are conversion, average order value, repeat purchase rate, revenue per user, margin and the level of returns. If recommendations increase revenue but at the same time reduce margin or raise returns, the result is only apparent. A good implementation improves not one chart, but a fuller picture of sales.
The most common mistakes are simple: no segmentation, acting only on a last-click basis and personalisation based on poor data. Another issue is ignoring returns, which means the store promotes products that fit customers’ needs badly. The second frequent mistake is launching automation without validating the input data. If the events are inconsistent, activation starts reinforcing bad decisions instead of correcting them.
Typical mistakes: what should you avoid when collecting data?
When collecting data, you need to avoid a lack of purpose, too many fields, silos, poor measurement quality and an incorrect assessment of results. The most common problem starts when a store gathers information “just in case”. Such a database quickly grows, but it does not help make better decisions about the offer, communication or budget. On top of that, every unnecessary form field increases friction and can reduce conversion.
The second costly mistake is separating data across systems without a shared logic for identifying the user and events. If you cannot connect the source of traffic, behaviour, purchase and return, analytics shows only a fragment of the picture. In practice, it then becomes difficult to assess which campaigns attract valuable customers and which only generate cheap traffic. The same problem appears with an inconsistent data layer, faulty events and a lack of regular measurement validation.
The third mistake is assessing sales solely through last-click or revenue alone. Such a model rewards the channel that closes the transaction, while ignoring the sources that build interest earlier. It is equally misleading to ignore margin, discounts and returns, because high turnover does not have to mean profitable growth. If the store does not distinguish between new and returning customers, it is easy to overpay for acquiring people with low LTV potential.
The fourth mistake is that data is collected, but does not translate into segmentation and action. Without dividing customers by Recency, Frequency, value, category preferences or discount propensity, all messages become too generic. As a result, the store sends the same prompt to someone after their first purchase and to a customer who has been buying regularly for months. The safest approach is to start with a few measurable segments, a simple tracking plan and metrics that combine sales with profitability.
FAQ
Frequently asked questions
What customer data is worth collecting in a store to improve sales?
The most useful are behavioural and transactional data, because they show intent and actual purchases. Demographic data alone is usually not enough if you do not know what the user did and what they bought.
Why are behavioural data more important than demographic data alone?
Because they show what the customer really does on the site before buying or leaving. They reveal hesitation points, funnel issues and signals that can be turned into sales decisions.
What transactional data tells you most about customer value?
The most telling are purchased SKUs and categories, order value, discounts used, purchase frequency, date of the last order and returns. If the store also analyses margin, it can see not only revenue, but the customer’s real profitability.
How does RFM help with customer segmentation in a store?
RFM organises customers by recency, frequency and monetary value. This makes it easier to distinguish active customers from those who are starting to churn, and to prioritise actions.
Can you collect lots of customer data without hurting conversion?
Not always, because every additional field and unclear consent can reduce conversion. It is better to collect less data, but only the data that is needed and has a clear use in sales.
How can you use collected data to genuinely increase sales?
You need to turn it into concrete actions, such as recommendations, personalisation, cross-selling, up-selling or cart recovery. It is worth assessing the effect through conversion, average order value, repeat purchase rate, margin and return rate.