

Web analytics only makes sense when the data is complete, consistent and interpreted correctly. In practice, the problems more often stem not from the tool itself, but from implementation mistakes, changes made to the site without testing, and imprecise conversion definitions. As a result, reports can look convincing, yet still lead to poor decisions about budget, campaigns and funnel optimisation. The most dangerous are those errors that do not stand out, because for a long time they distort the data without any clear warning sign. That is why it is worth looking not only at the numbers in reports, but also at the measurement logic, data sources and the way they are collected. This article shows which problems appear most often and how to approach identifying them in practice.
Most common mistakes in web analytics and their impact on data
The most common mistakes in web analytics include data gaps, event duplication, incorrect attribution and poorly defined conversions. Each of them distorts the picture of what the user is actually doing and which marketing activities deliver results. As a result, a company may optimise the wrong areas or draw conclusions based on data that is simply technically flawed.
A common problem is also measurement carried out without a clearly defined business goal. When it is not clear which decisions are meant to result from the data, the implementation quickly grows into dozens of events that explain very little. Not every event carries business value, and too many events usually cloud the picture instead of helping with analysis.
Data duplication most often stems from tags being embedded twice, multiple containers, incorrectly configured triggers or changes in the site interface. The same event can be sent on page load, on click and when a component state changes again. The effect is easy to predict: inflated page views, artificially boosted conversions and misleading engagement metrics.
Attribution errors appear when the traffic source is overwritten or gets lost along the way. This usually happens with incorrect redirects, missing UTM parameters being preserved, transitions between domains, payment systems or external forms. In reports, this later looks like a rise in direct traffic or a drop in campaign effectiveness, although the cause lies in the measurement configuration.
An incorrect definition of conversion can be just as costly. Clicking a button, opening a form or visiting a thank-you page does not always mean a real business result. A conversion should reflect the actual completion of an important action, rather than merely a signal that the user has started the process.
Increasingly, data quality issues also result from consent logic, browser limitations and script blocking. A drop in users or conversions does not have to mean a real fall in demand, because some data may simply not be recorded. That is why you need to be able to distinguish between a change in user behaviour and a loss of measurement, especially after implementing a new consent banner or rebuilding the site.
Practical approach to auditing analytics tool configuration
A practical approach to auditing analytics tool configuration comes down to verifying whether the data collected actually supports business goals, and then identifying the places where the data is created, distorted or simply lost. It is not worth starting the audit by reviewing reports, but rather by establishing which questions the business wants to answer using the data. Otherwise, you can perfect the tracking itself and still end up measuring things that are of little use for decision-making.
The first step is to inventory the entire implementation. You should check not only the analytics tool itself, but also the tag manager, data layer, advertising integrations, forms, checkout, subdomains and external systems. Most errors arise at the point where several systems meet, not in one place.
- which tools and containers are active on the site,
- which events and parameters are being sent and where they are defined,
- whether there are duplicate tags, events or identifiers,
- whether transitions between domains and systems are not causing sessions to break,
- whether campaign sources are being tagged correctly and whether those tags are retained.
The next stage is the measurement map, that is, assigning stages of the user journey to specific events and conversions. This makes it easier to distinguish which events are merely supportive and which genuinely support business decisions. It is a good moment to separate operational metrics from decision-making metrics and remove measurement that only adds noise.
Next, it is worth moving on to scenario testing. In practice, you recreate key user journeys across different devices, browsers and entry sources, checking the firing order of tags, the completeness of parameters and the consistency of the data with what actually happened on the site. Special attention should be paid to forms, payments, SPA-type pages and areas that have recently been rebuilt.
The audit should also cover attribution, consent and conversion definitions. You need to verify whether UTM tags are disappearing after redirects, whether cross-domain works wherever the user moves between domains, and whether consent logic is cutting off key measurement signals. Before you decide that a report is wrong, compare systems using the same event definition, time zone and attribution model.
A well-conducted audit ends not only with a list of problems, but also with a remediation plan. It should take into account change priorities, a dictionary of event and parameter names, campaign tagging rules, regression test scenarios and a method for ongoing data quality control after deployments. This is precisely the stage that determines whether analytics will continue to be maintained correctly after further changes to the site and campaigns.
Key stages of a correct web analytics implementation
A correct web analytics implementation starts with defining the measurement objective, then includes an inventory of the existing tracking, preparing a measurement map, implementing tags, validating the data and ongoing monitoring after changes are made. When this order is reversed, the data usually starts answering random questions instead of supporting specific decisions. First, you need to determine which decisions are meant to result from the data, and only then implement events and reports.
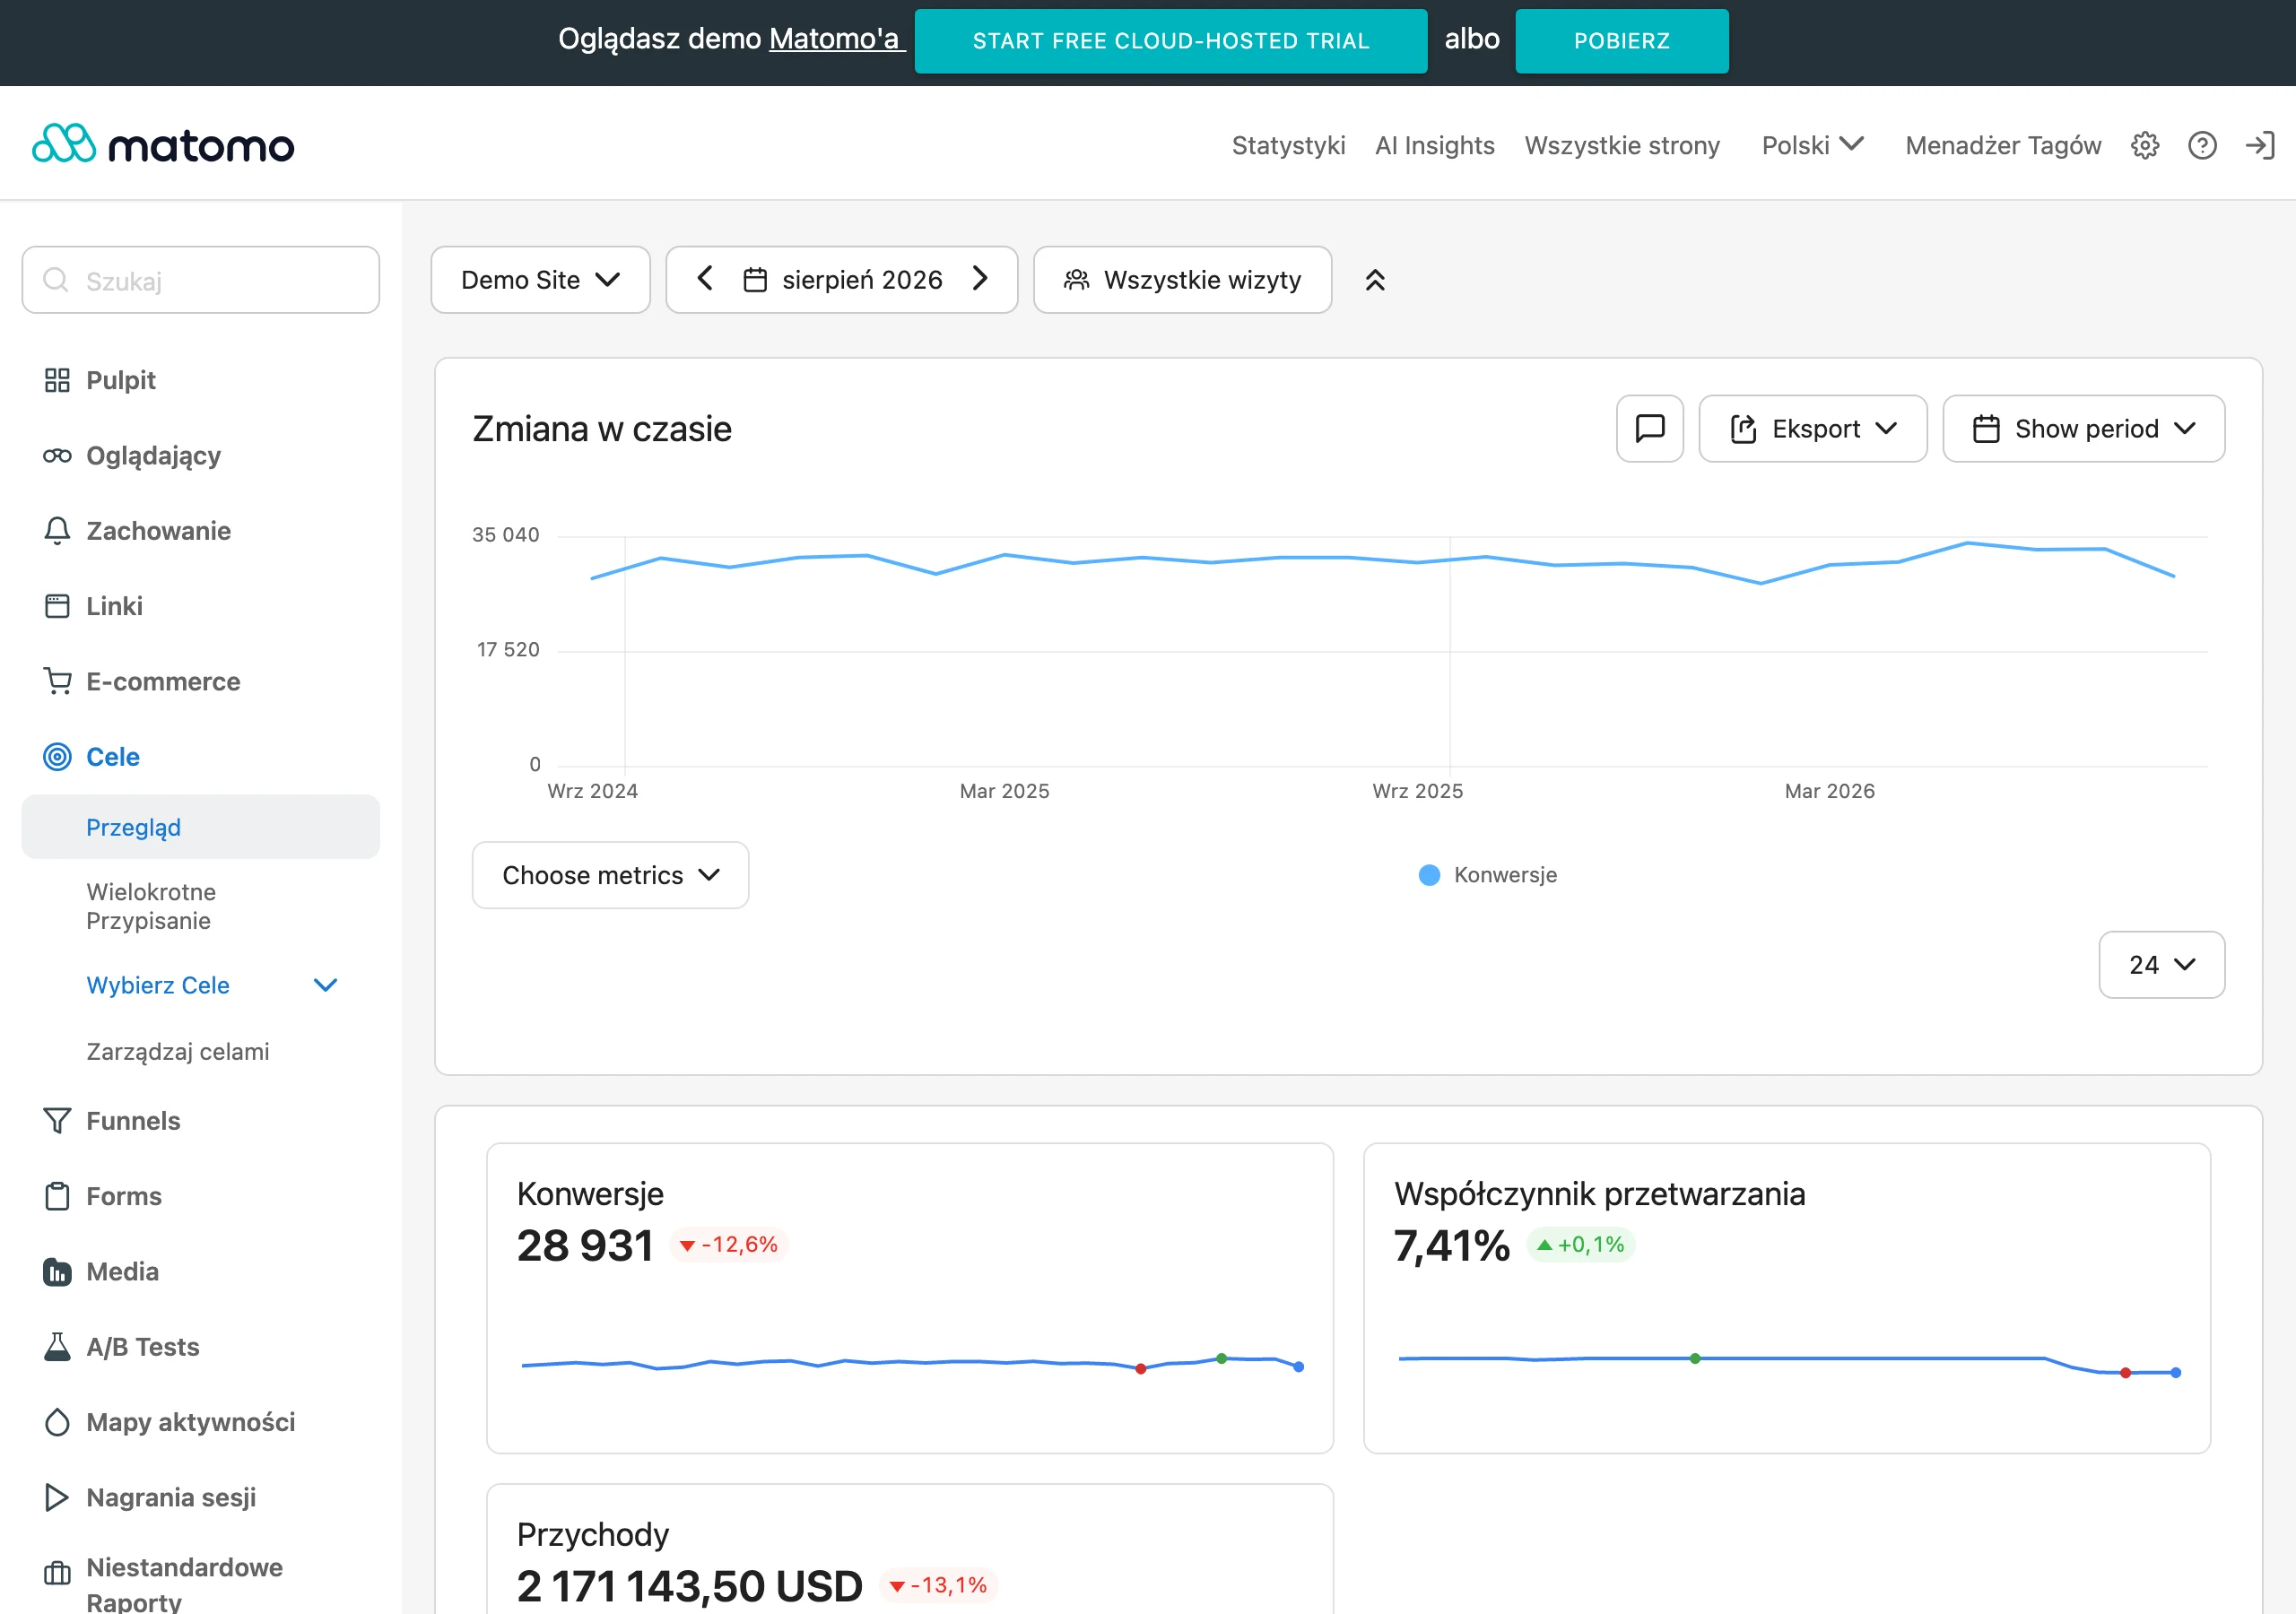
The first stage is to translate business goals into measurable metrics. In an online store these will be sales, transaction value, checkout start and abandoned baskets. In a service company, form submissions, phone calls, lead qualification and contact source may be more important.
The second stage is an inventory of the entire measurement ecosystem. It is worth checking which tools are already connected, whether they work through the tag manager, which events are being sent, where campaign parameters appear and whether the user moves between domains, subdomains or external systems. It is at this stage that problems with tag duplication, gaps in the dataLayer and session breaks during payments or forms are most often revealed.
The third stage is preparing a measurement map. It should connect the stages of the user journey with specific events, parameters and conversion definitions. Without one coherent measurement plan, the same type of action is measured differently on individual subpages, which quickly throws reporting out of alignment.
The fourth stage is the actual technical implementation. It includes configuring tags, firing rules, parameters, consents, internal traffic filters and integrations with advertising systems or CRM. In the case of SPA sites or after major frontend changes, it is particularly important to make sure that events fire when the interface state changes, rather than only on a classic page reload.
The fifth stage is validating data quality. Key user scenarios need to be reproduced on different devices, in different browsers and with different traffic sources. It is not enough that the tag “fires” in preview; you also need to confirm that it reaches the reports with the correct name, parameters and attribution.
The final stage is documentation and maintenance. Well-implemented analytics does not end on the day the changes are published, because most failures appear later, for example after a new consent banner, a form change, a site migration or a checkout update. After every major change on the site, it is worth running an analytics regression test before the problem reaches the reports and starts distorting decisions.
How to correctly map business goals to analytics events
Correctly mapping business goals to analytics events comes down to assigning each key stage of the user journey an event that genuinely reflects progress towards the business outcome. In practice, this means moving away from the “what can be clicked” approach and towards the question “what really matters to the business”. This way, the report is not limited to a log of activity, but allows you to assess the effectiveness of channels, campaigns and individual funnel elements.
To begin with, it is worth precisely naming the business goal and the decision the data is meant to support. When the goal is sales, the key question concerns which sources and campaigns lead to transactions and at which points users drop off along the way. If the priority is lead generation, you need to distinguish a plain contact from a quality lead that meets the minimum commercial criteria.
Next, the goal should be broken down into stages on the user side. In e-commerce these will be, for example, viewing a product, adding it to the basket, starting checkout, choosing payment and purchasing. In a service company it might look like this: entering the offer page, clicking the phone number, starting the form, submitting the form, and then lead qualification in the CRM.
At this stage, the key thing is to separate business events from technical ones. Clicking the “Submit” button does not have to mean the form has been sent, because the user may encounter a validation error or abandon the process. The conversion should be the event confirming the real outcome, not the mere attempt to carry out the action.
Each important event should have a set of parameters necessary for analysis. For a form, these will be, for example, the form type, location on the page, service category and traffic source. In the case of a purchase, the transaction ID, value, currency, products and information on whether the event has already been sent before are important.
In practice, the principle of minimalism works well. It is better to measure less but have clearly defined events than to collect hundreds of minor interactions that add little value. Too many events make analysis harder, increase the risk of errors and blur attention away from the truly decision-driving metrics.
Finally, you need to make sure the mapping is consistent in reporting across systems. If the same “lead generation” in analytics means form submission, while in the CRM it means only an approved contact, discrepancies in the numbers are natural, but they must be clearly named and easy to explain. The most important thing is to use one glossary of terms and one conversion definition across the whole team, otherwise every report will be talking about something different.
Methods of validating data quality in analytics
Methods of validating data quality in analytics boil down to checking whether the data are complete, consistent and reflect the actual user journey. The most common trap is assuming that if events appear in the report, measurement is working without issue. In practice, it is worth confirming three things: whether the event fires at the right moment, whether it passes the correct parameters, and whether it occurs more often than it should. Most problems do not show up in aggregate reports, but when recreating specific user scenarios step by step.
The starting point is a scenario test. You check the entry from a campaign separately, the journey through key pages, interaction with the form, starting the purchase process and completing the conversion. It is worth carrying out such a test on a computer and a phone, as well as in different browsers, because many errors only emerge with a specific combination of device, consent and traffic source.
The second method is technical validation of individual hits and events. It involves checking whether the event name follows the standard, whether the parameters have the expected values, and whether the sending order is logical. If a form sends a success event before the actual submission confirmation, the report will show conversions that did not really happen in the business.
Detecting duplication is equally important. An event can fire twice because of two containers, because of simultaneous tracking in code and through a tag manager, or because of a component being re-rendered on the page. If the number of conversions rises after implementation, first rule out duplication, and only then look for improved results.
The next step is comparing data across systems, but only with the same definition. Analytics, the ad system and CRM will almost never show identical numbers, because they differ in attribution logic, time zone and conversion window. The difference alone does not have to mean an error, but it does require checking that the same moment, the same conversion type and the same traffic scope are being compared.
In day-to-day work, anomaly monitoring works well. A sudden drop in traffic from organic, a spike in direct, the disappearance of a specific event or an unusual increase in the conversion rate are signals to check the implementation, not only to carry out business analysis. The best data validation is constant monitoring after changes to the site, forms, checkout and consent banner.
It is also worth understanding the impact of consent and browser limitations. Some data gaps result from the user not giving consent or the browser restricting tracking, rather than from an implementation error. That is why assessing data quality should separate measurement loss from a real change in user behaviour.
Effective strategies for improving attribution in reports
Effective strategies for improving attribution in reports boil down to retaining source information from the user’s first visit right through to conversion. The biggest distortions appear when campaign parameters are lost after a redirect, the session breaks when moving between domains, or the system mistakenly assigns the conversion to a direct visit. In practice, better attribution is rarely the result of one large fix. More often it requires tidying up several small elements which together determine the quality of reporting.
The first pillar is consistent campaign tagging. Every campaign should follow one naming standard for source, medium and campaign, without custom exceptions for individual teams or tools. If you use “paid_social” one time and “social_paid” or “facebook-cpc” another time, the report starts mixing channels and loses its decision-making value.
The second pillar is preserving campaign parameters during technical transitions. Redirects, link shorteners, intermediary pages, embedded forms from external systems and all places where the URL is rewritten should be reviewed. If the UTM parameters disappear along the way, the analytics system will assign some conversions to the wrong source or to direct.
The third area is cross-domain. When a user moves between the store, payment gateway, subdomain, external form or booking system, analytics should recognise that we are still dealing with the same session or the same user within a given measurement model. Without the right configuration, artificial entrances from your own domains, distorted paths and understated performance of paid channels appear.
It is also worth monitoring referral and self-referral exclusions. If the system treats the payment domain or your own subdomain as a new traffic source, the last step in the path will overwrite the actual acquisition source. This is one of the most common reasons why campaigns look weaker than they really are.
Improving attribution also requires a shared vocabulary between analytics, advertising and sales. The team should clearly agree what they mean by a conversion, at what point it is counted and according to which model the data are combined. Without such agreements, it is easy to conclude that one report contains an error, even though in reality each system shows a different fragment of the same journey.
Finally, you have to accept the limitations of measurement. User consent, script blocking, differences between devices and reporting delays mean that perfect data alignment remains unattainable. The goal is not a report with no differences, but a report in which the sources of error are known, limited and stable enough to allow sensible budget decisions.
Typical risks and how to avoid them in internet analytics
Typical risks in web analytics include: loss of part of the data, misreading traffic sources, false conversions and a lack of oversight after changes on the site. In practice, it is rarely possible to point to one guilty element. Usually several small inconsistencies add up to a report that looks convincing, yet still leads to poor decisions. The most dangerous are not the gaps visible straight away, but the errors that remain off the radar for a long time.
- Risk of losing measurement because of consent, script blocking and browser restrictions. It is reduced by clearly distinguishing a drop in real traffic from a drop in measurability and by analysing the data with consent logic in mind.
- Risk of distorting traffic sources through missing campaign tags, loss of UTM parameters in redirects and incorrect cross-domain tracking. It is reduced through a common tagging standard and regular tests of the entire entry path, all the way to conversion.
- Risk of false conversions through triggering an event too early or firing it multiple times. It is avoided when the conversion is linked to the actual completion of the process, rather than to the click or opening of the step itself.
- Risk of reporting chaos caused by too many events and a lack of a shared naming dictionary. Limiting measurement to events needed for decision-making and consistent parameter naming helps to reduce it.
Another significant risk is confusing differences between systems with an implementation error. An analytics tool, an ad platform and a CRM will almost never show identical values, because they work on the basis of different attribution models, conversion windows and counting rules. Before you start “fixing” the data, compare definitions, time zones and the moment the event is recorded.
Many issues come to light after technical changes, even if the analytics itself has not been modified. A form rebuild, a new checkout, an SPA rollout or a new consent banner often change the loading order of elements and break tag logic. Every frontend change should have a simple analytics regression test, just like a functional test.
A separate risk category is failing to distinguish operational metrics from business metrics. A click, scroll or pop-up open can support diagnostics, but should not “compete” with a lead, transaction or qualified contact. When everything becomes a KPI, the team loses priorities and optimises actions that do not improve performance. First determine 3-5 decision metrics, and only then choose supporting events.
The most practical protection against these risks is a continuous analytics maintenance process, rather than a one-off implementation. It includes an owner of measurement, event documentation, campaign tagging rules, a test checklist and a periodic review of data quality. If no one is formally responsible for analytics after implementation, errors return with every major change to the website or campaigns.
FAQ
Frequently asked questions
What are the most common mistakes in web analytics?
The most common issues are missing data, event duplication, incorrect attribution and poorly defined conversions. Each of these problems distorts the picture of user behaviour and marketing effectiveness.
Why is data duplication in analytics dangerous?
Because it inflates pageviews, conversions and engagement metrics. It most often results from tags installed twice, multiple containers, incorrect triggers or changes in the site interface.
How do you spot attribution errors in reports?
A sign may be an increase in direct traffic or a drop in campaign performance without a real business cause. The problem usually lies in redirects, lost UTM parameters, cross-domain journeys or external systems.
Can a button click be a conversion?
Not always, because clicking, opening a form or visiting a thank-you page does not necessarily mean a real business outcome. A conversion should reflect the actual completion of a meaningful action.
How do you properly audit a web analytics setup?
First, you need to define business goals, then check the entire measurement ecosystem: tags, dataLayer, integrations, forms, checkout and domains. Scenario testing, attribution checks, consent and conversion definition validation are also important.
When does a drop in users not mean a real drop in traffic?
When part of the data is not recorded because of consent logic, browser limitations or script blocking. After site changes or a consent banner update, you need to distinguish between a change in user behaviour and a loss of measurement.