

An organic traffic report for the board only makes sense if it leads to business decisions. Information about an increase or decrease in visits is not enough on its own, because it says nothing about traffic quality or its impact. Credibility is built when you clearly separate facts from interpretation and connect SEO with leads, revenue, cost and risk. That is why a good report does not start with a traffic chart, but with the question of what has really changed for the business.
How do you define the purpose of an organic traffic report?
The purpose of an organic traffic report is to show the impact of SEO on business performance, not just changes in the number of visits. The board wants to know what changed, why it happened and whether it requires action. If the report does not answer these three questions, it quickly loses relevance. Traffic itself is a signal, but it is not the goal.
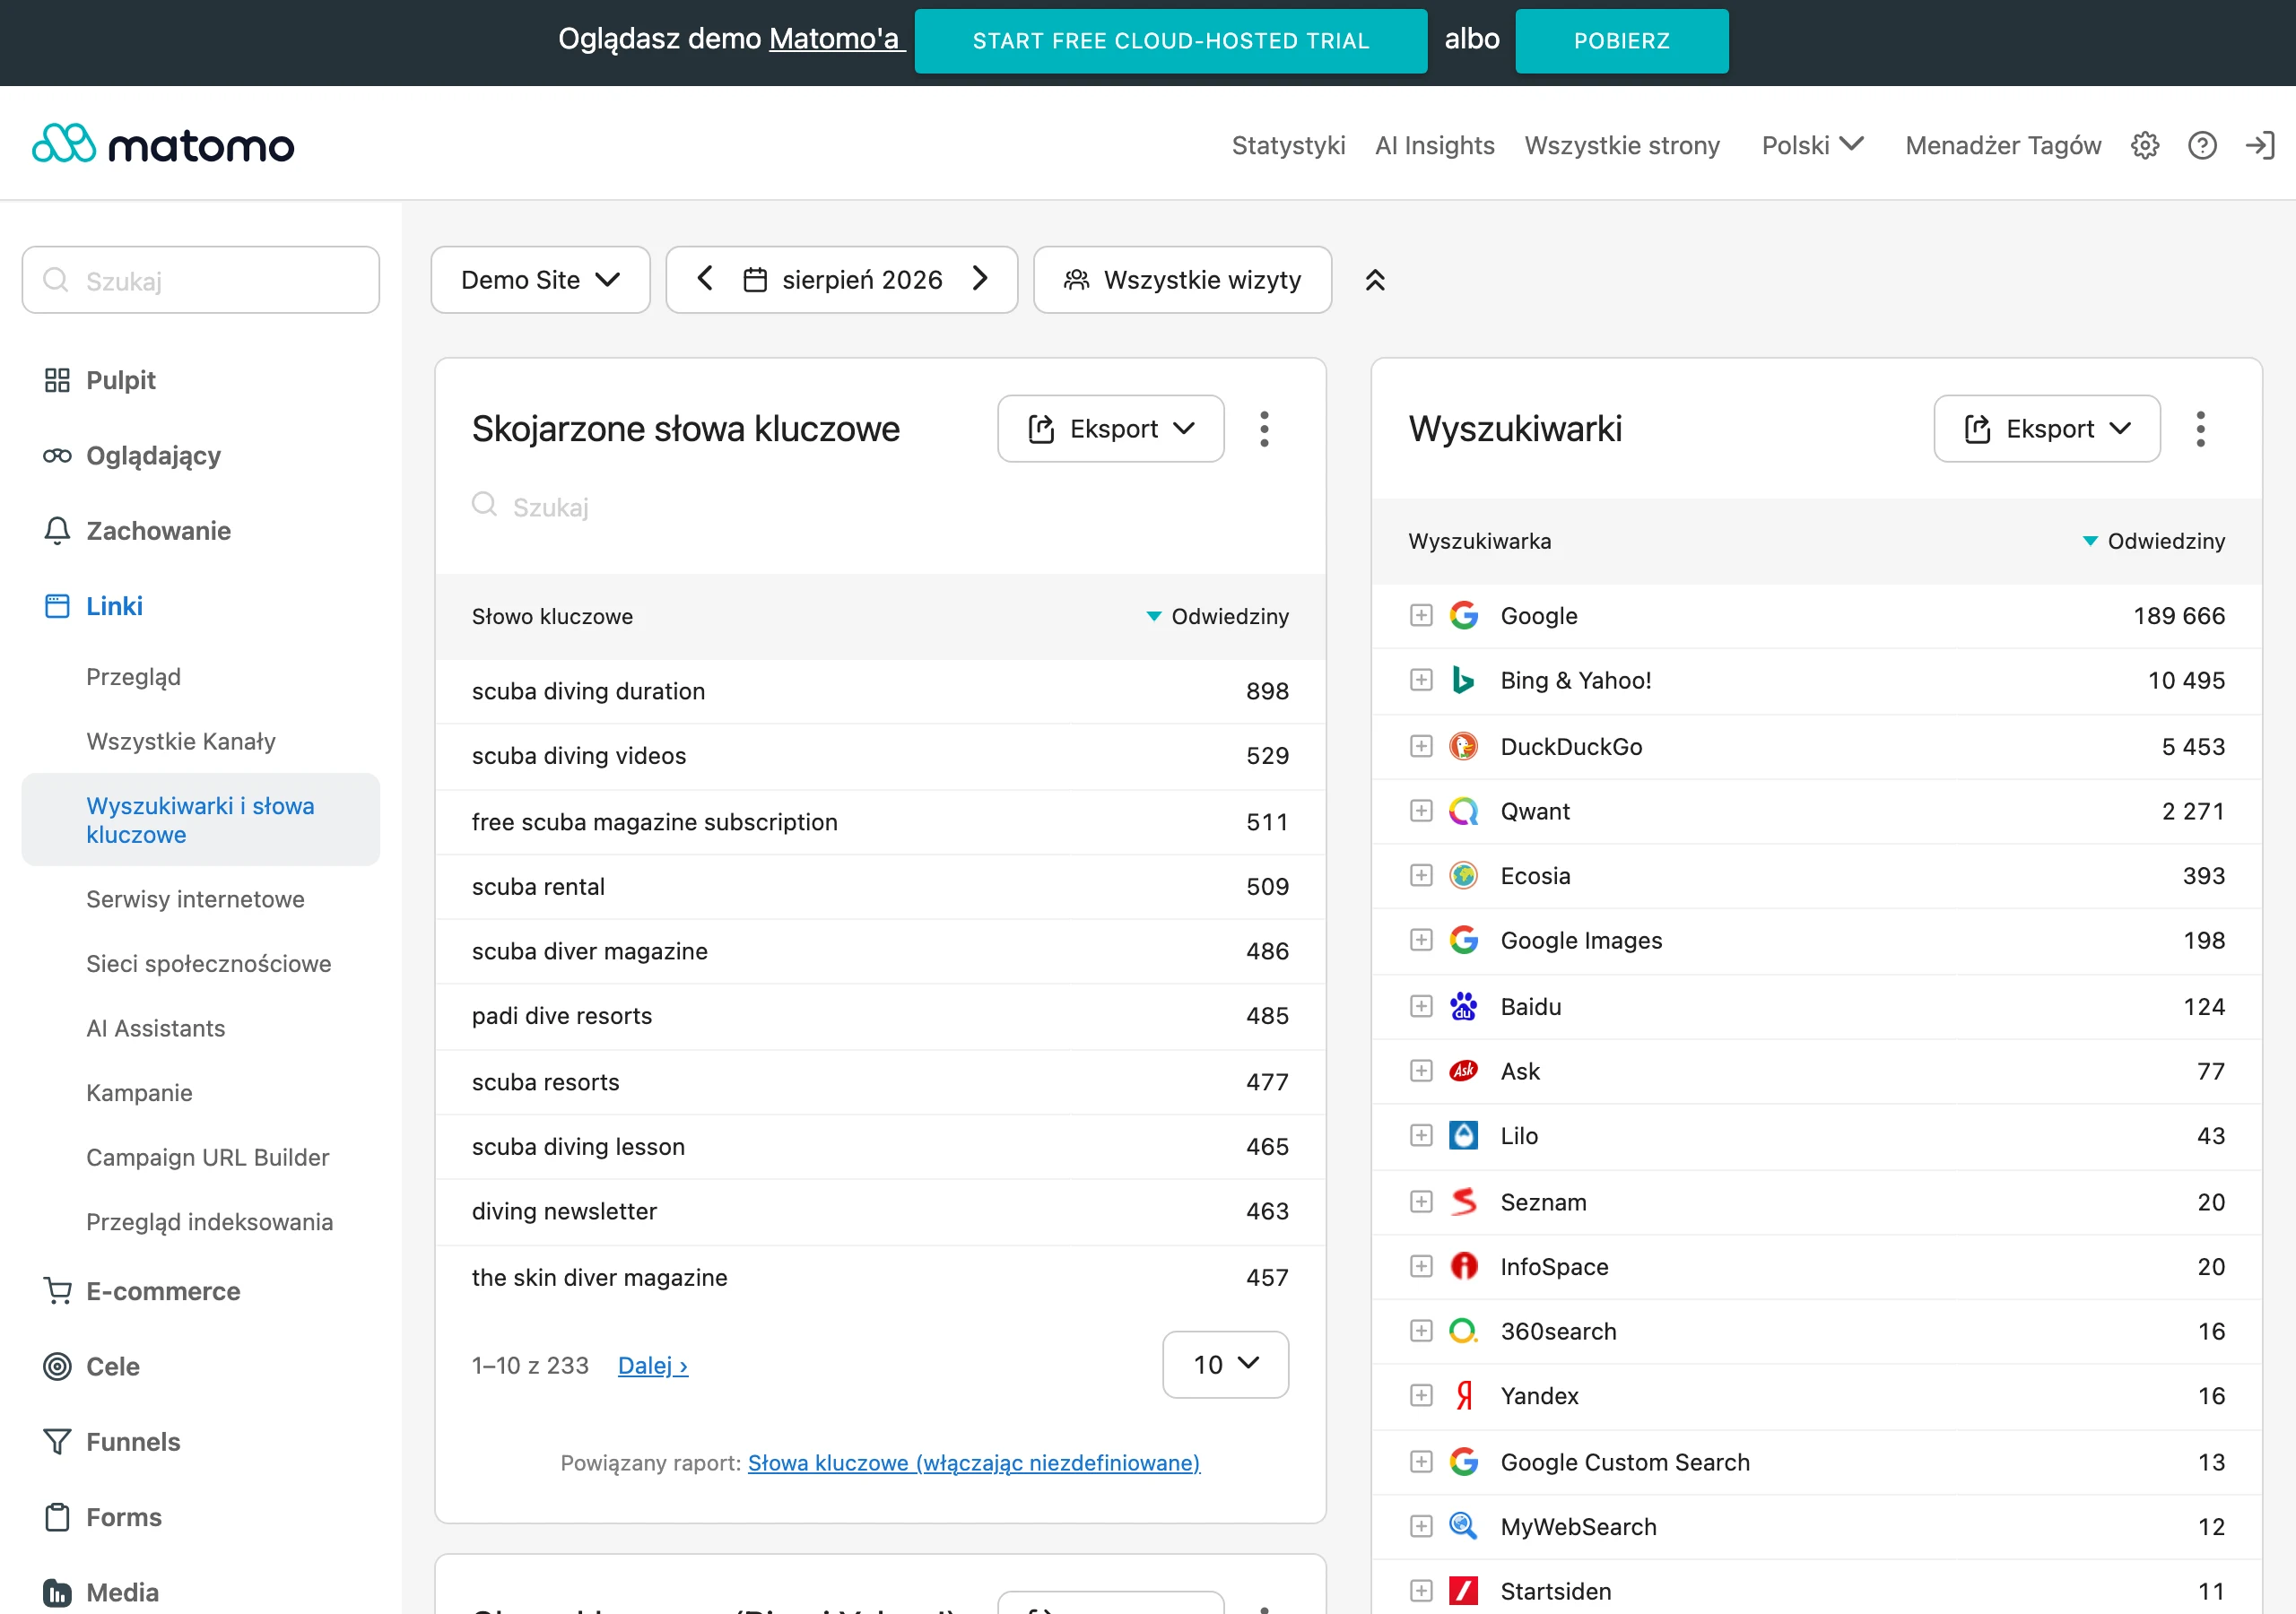
In practice, this means the report should connect organic traffic with leads, revenue, acquisition cost and risk. An increase in sessions without an increase in conversions does not necessarily mean improvement. A drop in traffic is not always a problem either if leads are holding steady or the share of valuable visits is growing. This way of looking at things protects against overly simple conclusions.
If full revenue attribution to SEO is limited, the report should aim to show the closest reliable impact. Most often these will be leads, conversions, the share of non-brand traffic, visibility and CTR. These are leading indicators that help assess the direction of change before you see the full business effect. This gives the board a picture of the situation, not a promise of the result.
What data is key for analysing organic traffic?
The key data is what allows you to distinguish a change in traffic from a change in visibility, visit quality, conversions and measurement itself. First, you need to establish definitions, because a click, a session and a user do not mean the same thing. Clicks come from search engine data, while sessions and users come from analytics. Mixing these sources into one conclusion without noting the difference undermines credibility.
The minimum data set should cover several layers, because the total number of visits alone is too broad. The most important elements are:
- clicks from organic results,
- sessions and users from the organic channel,
- conversions and revenue attributed to organic traffic,
- CTR and visibility level,
- landing pages and key directories,
- brand versus non-brand breakdown,
- country, device, content type and query intent.
Each of these data groups answers a different question. Clicks show user reactions in search results. Sessions and users show what reached the site according to analytics. Conversions and revenue show whether the traffic has business value.
Segmentation is necessary because the aggregate result hides the cause of the change. Brand traffic often behaves differently from non-brand traffic. Offer pages have a different role from guides, and mobile can be affected by different issues than desktop. Without this split, it is difficult to assess honestly whether demand, visibility or traffic quality has changed.
For the board, data that combines quality with trend is particularly important. If visibility and clicks are growing but conversions are falling, the problem is not in SEO alone or it requires a broader diagnosis. If clicks are falling while visibility is stable, you need to check CTR and changes in the results layout. If everything falls at once, the likelihood of a technical problem, a measurement error or a larger market shift increases.
Why is data segmentation important?
Data segmentation is important because total organic traffic hides the source of the change and its real business value. The same aggregate result can mean an improvement in quality or a growing risk. Without a split, it is easy to mistake a neutral trend for success or a problem. The board needs to be shown which part of the traffic is growing, which is weakening and what that changes for leads or revenue.
The most important split is brand versus non-brand, because they answer different business questions. Brand traffic often reflects brand strength and earlier marketing activities. Non-brand traffic better shows whether SEO is capturing new demand beyond the brand name itself. When the total is flat but non-brand is falling, the company may be losing market share despite stable charts.
Just as important is the split by landing pages, directories, country, device, content type and query intent. Growth in traffic on guides does not make up for a decline on offer pages if those are what generate leads. A drop only on mobile suggests a different problem than a drop across all devices. This breakdown makes it quicker to distinguish a change in demand from a drop in visibility, CTR or a technical issue.
In practice, it is worth maintaining a fixed set of segments and comparing them in every report. This way, the board sees the trend, not a random slice of data. A simple structure works well: brand versus non-brand, transactional versus informational pages, and the main markets and devices. This split reduces the risk of overinterpretation and makes it easier to decide where to act first.
Which KPIs are important for the board in the context of SEO?
The key KPI for the board are those that connect SEO with business outcomes and show the direction of change earlier than revenue. At the top are leads, conversions and revenue attributed to organic traffic. Alongside them, it is worth showing leading indicators that explain where the result comes from. Rankings alone or the number of keywords are too far removed from a business decision.
Usually, a short set of KPI is enough:
- leads or conversions from organic traffic,
- revenue attributed to SEO, if the measurement is reliable,
- the share of non-brand traffic in total organic traffic,
- visibility and clicks for key segments,
- CTR in search results,
- conversion rate for the most important landing pages.
Each of these metrics answers a different question. Leads and revenue show the end result. Non-brand share says whether SEO is capturing new demand, rather than just collecting traffic on the company name. Visibility and CTR help distinguish a problem with presence in the results from a problem with the snippet or SERP layout.
A good KPI set should not be long, just decision-oriented. If visibility is growing but leads are not, you need to check the quality of landing pages and intent matching. If leads are stable despite a drop in clicks, not every traffic decline requires an alarm. The board should receive metrics that show impact, trend and risk, not a full export from tools.
How should changes in organic traffic be interpreted?
Changes in organic traffic are interpreted by separating five possible causes: demand, visibility, CTR in SERP, a technical issue and a measurement error. This order matters, because a similar drop in sessions may result from completely different problems. First, you check whether interest in the category or queries has changed. Only then do you assess whether SEO has lost exposure, or is simply converting it into clicks less effectively.
In practice, you look at segments, not one total figure. If clicks are falling only on non-brand offer pages, the problem has a different weight than a drop on informational content. If traffic is falling only on mobile or in one country, this more often points to a deployment, speed, indexing or hreflang issue than to a change in demand. Such a split shortens the path from chart to sensible diagnosis.
The time context changes interpretation more than the chart itself. You need to account for seasonality, migrations, publications, deployments, algorithm updates, changes in consent and changes in search results layout. For example, a drop in reported sessions after a consent change does not necessarily mean a drop in actual visits. Conversely, a drop after a deployment may be due to a technical error, even with stable demand.
For some queries, a drop in clicks does not necessarily mean lower brand presence, because AI answers and expanded SERP elements can take over user attention. That is why, alongside clicks, it is worth monitoring CTR, non-brand share, brand growth and presence in AI answers. If exposure is growing and clicks are standing still, you must not automatically call it an SEO failure. Credibility grows when you separate hard fact from hypothesis and show what the data confirms, and what you still do not know.
The final conclusion should be based on several sources, not on one tool. Search engine data shows behaviour in the SERP, analytics shows visits and conversions, and crawls, logs, annotations and indexation monitoring help explain the cause. When sources differ, that needs to be stated openly, rather than smoothing over the message. The board will accept uncertainty more quickly than an overconfident statement without evidence.
What decisions and priorities should be set based on the analysis?
Based on the analysis, decisions need to be set according to business impact, implementation time, dependencies and risk. Priority does not come from the size of the chart, but from what changes leads, revenue or the likelihood of further decline. You treat quick fixes separately from strategic topics. This way, the board can see what to do now and what requires a work programme.
The simplest way to organise decisions is by type of problem:
- Problems with crawling, indexing or errors after deployment are a critical priority, because they cut off traffic at source.
- A drop in CTR with stable visibility points to work on snippets, schema and the quality of result presentation.
- A drop on non-brand transactional pages has a higher priority than changes on low-intent content.
- Topics requiring multiple teams, such as migrations, hreflang or content restructuring, are planned as strategic initiatives.
This logic helps avoid wasting time on loud but low-importance topics. If traffic is growing on guides while leads from key landing pages are falling, the decision should concern the pages with the highest business value. If the problem is measurement, the first decision is to fix the definitions and data sources. Without this, even a correct operational recommendation will be poorly defended.
You also need to align priorities with organisational dependencies. Some SEO actions can be implemented quickly, but others require the development team, the content team or approval from the local market. That is why the recommendation should state the owner, sequence and risk of delay straight away. This turns the analysis into a plan, rather than a wish list.
The decision presented to the board should describe the direction and the conditions for success, not promise exact growth. It is better to say that restoring indexation removes a barrier to acquiring traffic than to declare a specific percentage increase. The most credible recommendation combines the cause, business impact, level of confidence and the next step to take.
How should the analysis results be communicated to the board?
The analysis results are communicated to the board in a short format that combines the change, cause, business impact, level of confidence and decision. This structure helps move from SEO data to company consequences without losing the point. The board does not need a full operational dashboard, only a clear answer on what requires action now. The best report can be read in a few minutes and defended with additional data if questions are asked.
It is most practical to build the message on one page and in a fixed order. That way, each successive analysis is comparable, and the discussion does not drift into tool-related detail. A good structure looks like this:
- what changed and by how much,
- which segment the change concerns,
- what the most likely cause is,
- what the impact is on leads, revenue, cost or risk,
- what the level of confidence in the conclusion is,
- what decision is recommended and who should make it.
Credibility is built by separating fact from interpretation. A fact may be a drop in clicks or sessions in a specific segment, while the effect of an algorithm update or a change in the SERP layout is a hypothesis. If search and analytics data show something different, you need to say so directly and explain what the difference concerns. That is more important than trying to smooth the message, because management will trust a cautious conclusion faster than a confident thesis with no substance behind it.
Communication errors most often result from simplifications that look good on a slide but do not stand up well to questions. Do not show total traffic without quality, do not compare periods with different seasonality, and do not promise precise growth after implementation. When clicks fall and exposure rises, do not talk about failure without checking CTR, brand and presence in AI answers. The final message should end in one sentence: what happened, why it matters and which next step reduces risk or improves the result.
FAQ
Frequently asked questions
which data are most important in an organic traffic report for management?
The most important data are those that show not only traffic, but also its value: clicks, sessions, users, conversions, revenue, CTR and visibility. You also need to take into account the split between brand and non-brand, landing pages, devices, countries and content type.
why is organic traffic growth on its own not enough for management?
Because growth in visits alone says nothing about traffic quality or its impact on the business. Only when you connect it with leads, revenue, cost and risk can you show whether SEO is actually improving business performance.
does a decline in organic traffic always mean an SEO problem?
No, because a drop in traffic can also result from changes in demand, seasonality, the layout of search results, a measurement error or consent changes. If leads are stable or the share of valuable visits is growing, a drop in sessions alone does not have to be a cause for alarm.
how do you distinguish a drop in visibility from a CTR problem in SEO?
If visibility remains stable and clicks are falling, it is worth checking CTR and changes in the SERP first. If exposure also falls, the problem is more likely to be visibility rather than the attractiveness of the result itself.
why is segmentation of organic traffic so important?
Because the overall result can hide which part of the traffic is growing and which is weakening. Splitting it into brand and non-brand, transactional and informational pages, or devices helps you identify the cause of the change and its business impact faster.
what decisions should follow from an analysis of organic traffic?
Priorities should depend on the impact on leads, revenue and risk, not on the size of the chart. Critical issues are crawling and indexing problems and post-launch errors, while a drop in CTR or issues on key landing pages require separate action.