

Large website traffic does not yet prove that the offer genuinely interests potential customers. In practice, what matters is the moment when a user leaves reading mode and moves into action: views the offer, checks the pricing, clicks a CTA, starts a form or simply gets in touch with the company. The most common mistake is assessing marketing effectiveness by the number of sessions instead of by the quality of behaviour and the quality of leads. And that is not a cliché, but everyday reality in services, B2B and wherever decisions take weeks to mature. What does it matter that the form exists if it later turns out that the enquiry does not fit the offer at all. That is why traffic analysis needs to be tied to data on the traffic source, on-site behaviour and feedback from sales.
How to assess genuine interest in the offer based on website traffic?
Genuine interest in the offer is visible not in the number of visits itself, but in whether users perform actions typical of the buying or contact stage. A visit to a how-to article carries a different weight than a visit to a service page, pricing page or form, because a different intent sits behind it. First, informational traffic needs to be separated from commercial traffic, because without that the statistics can easily look good only on paper.
In practice, several groups of signals need to be read at once. Time on site alone or a low bounce rate can be misleading, because a user may consume the content out of curiosity, with no intention of buying whatsoever. The key is behaviour closer to a decision, the kind that leaves a trace on the offer side, not just on the content side.
- visits to offer subpages, pricing, buying FAQs and contact,
- clicks from the blog or guide to the offer,
- clicks on CTA buttons, telephone number, e-mail or chat,
- starting and submitting a form,
- the user returning to the site after the first visit,
- booking an appointment, booking a demo, adding to basket or purchase.
For this data to make sense, micro- and macro-conversions need to be separated. Micro-conversions show that interest is growing, for example moving to the offer or starting a form, that is the first step, still without a declaration. Macro-conversions confirm readiness to act, for example sending an enquiry or making a purchase. If micro-actions are growing but enquiries are not, the problem usually lies with the offer, CTA, form, trust or traffic fit.
A full assessment also requires looking at the source of the visit, landing page and lead quality on the sales side. The same channel can deliver good traffic for one service and poor traffic for another, because what matters is the match between intent and a specific subpage, not the “volume” itself. In service businesses and B2B, it is worth combining analytics with CRM, because only there does it emerge which enquiries are valuable and which are random, outside the area of operation or unsuitable for the offer. Without a shared definition of a valuable lead, marketing and sales often draw completely different conclusions from the same data.
The importance of traffic quality analysis in the context of SEO and paid campaigns
Traffic quality analysis quickly shows whether SEO and paid campaigns are bringing people with buying intent, or merely inflating the visits counter. This is crucial, because a high volume of visits can go hand in hand with a meagre number of enquiries when the traffic lands mainly on educational content or comes from adverts set too broadly. Only the combination of data on source, query, landing page and conversion makes it possible to assess the real effectiveness of a channel honestly.
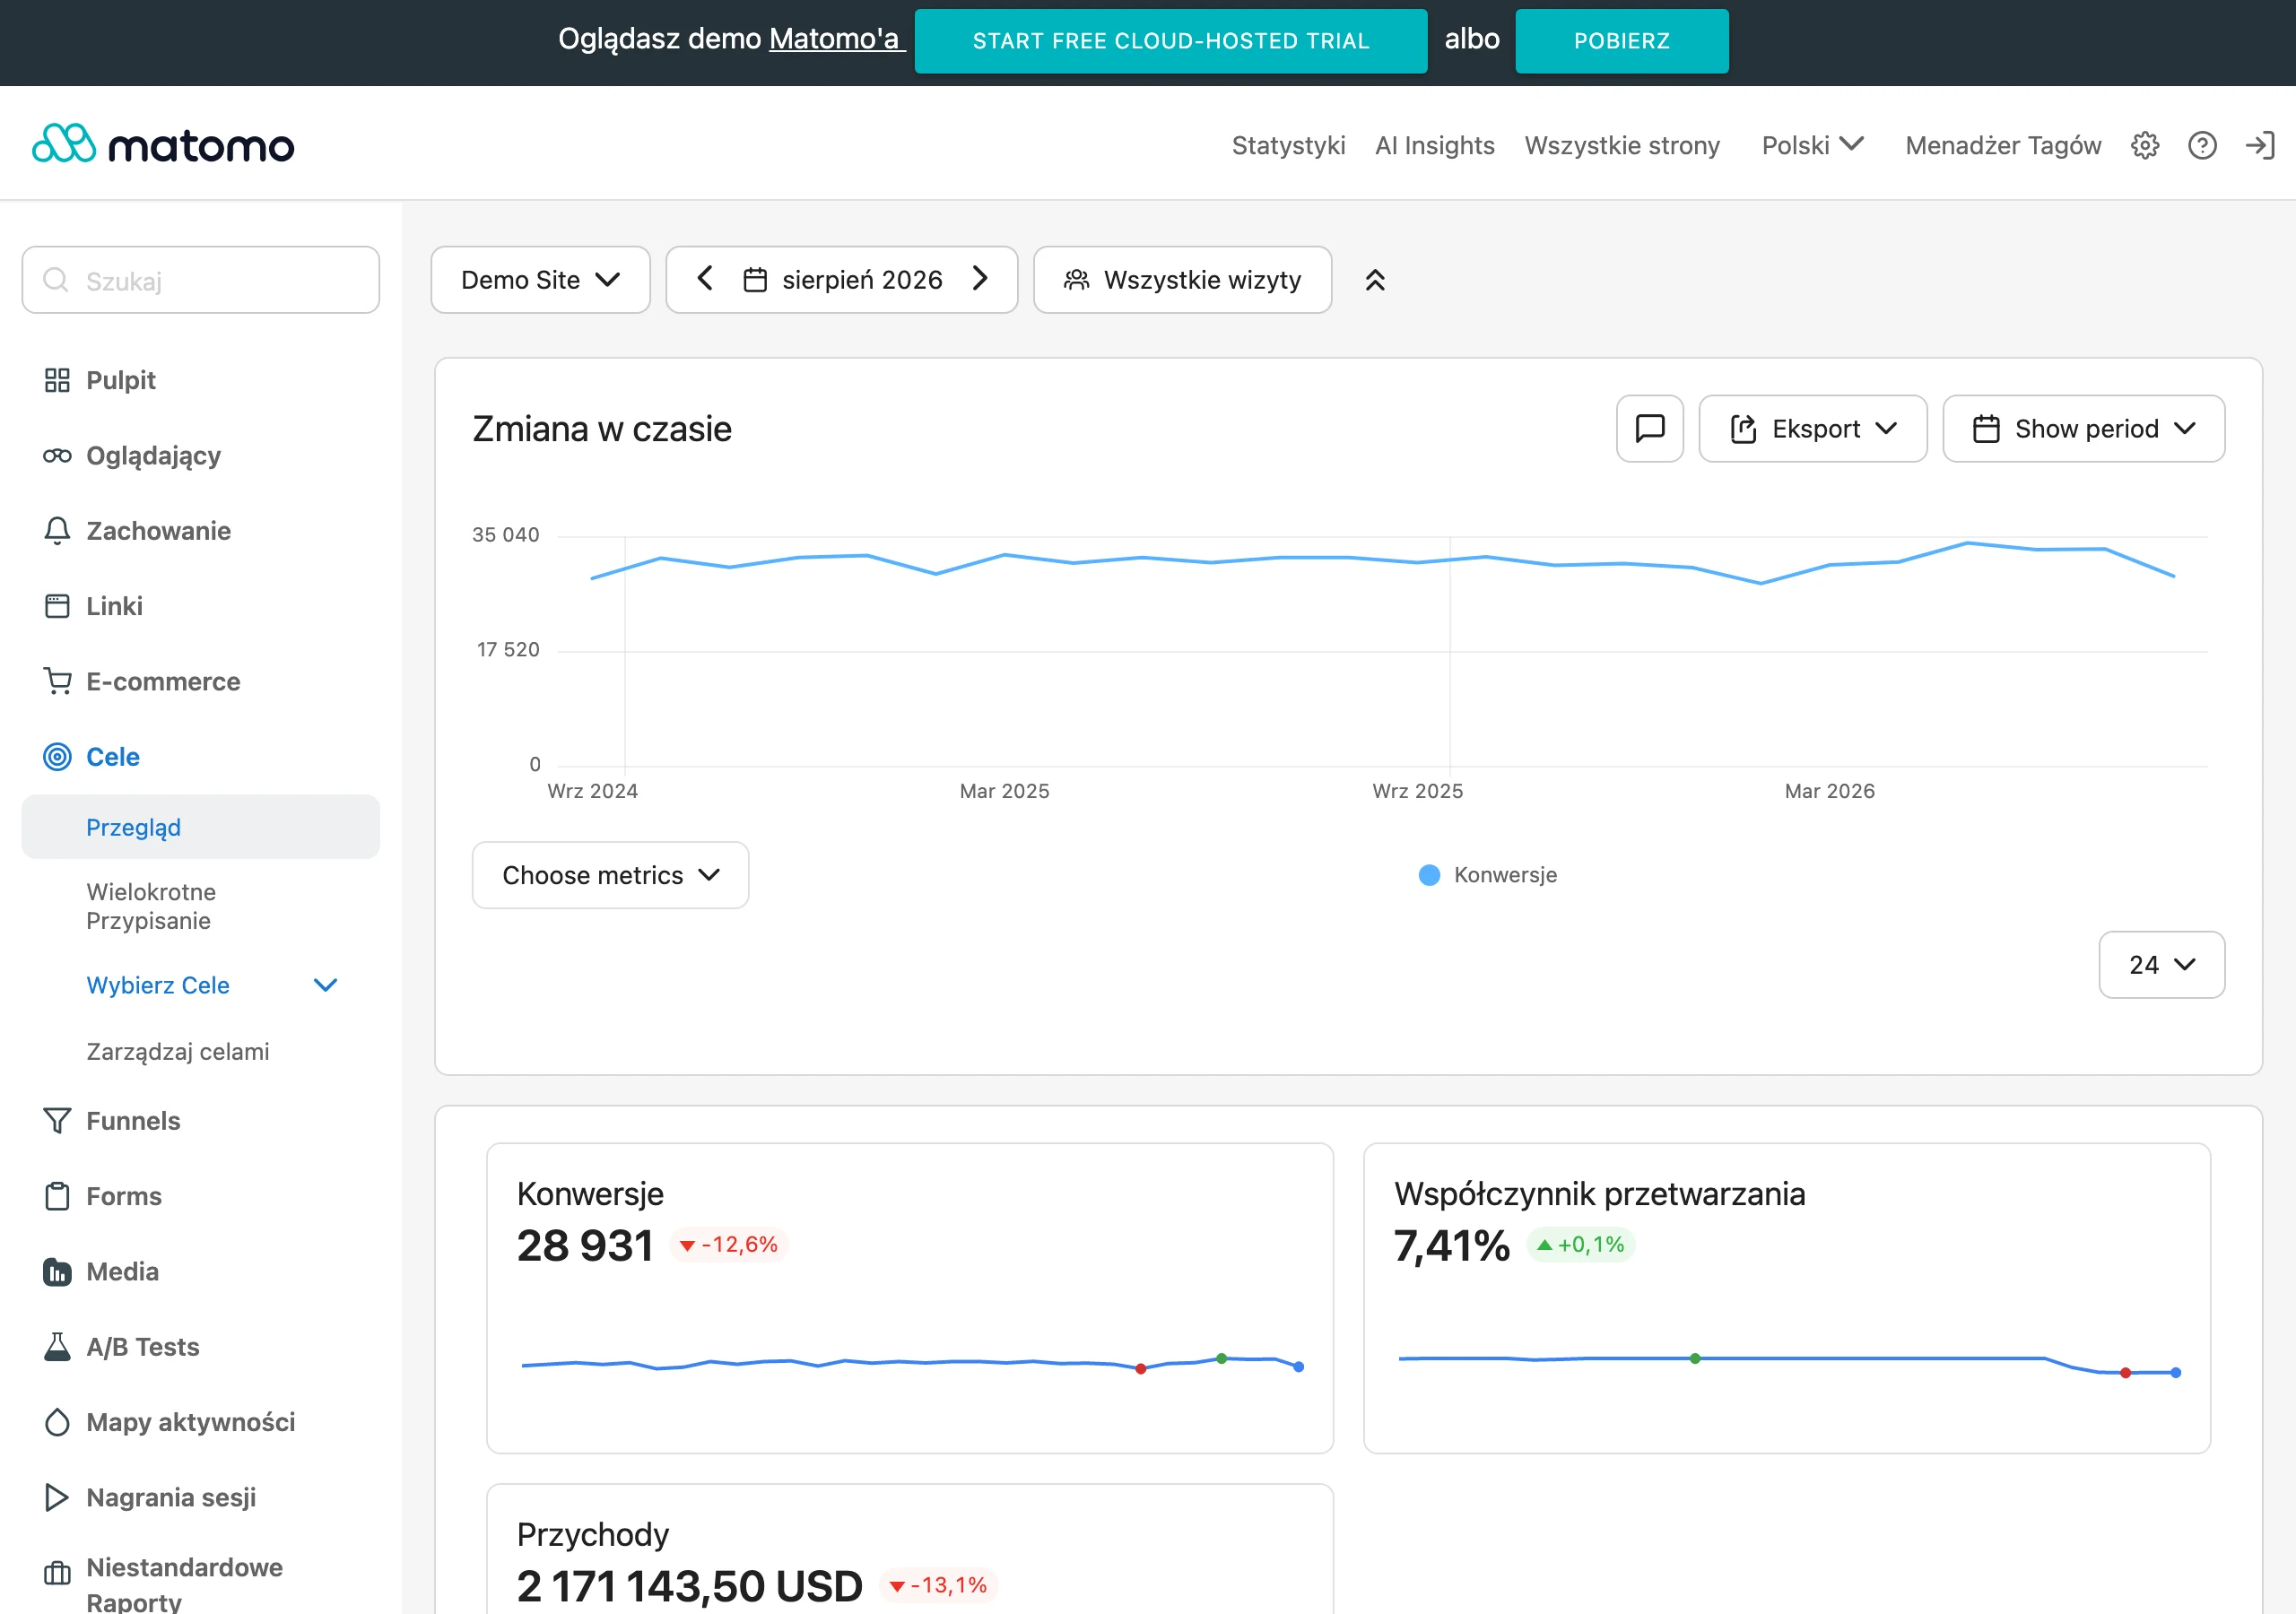
In SEO, this difference can be merciless. Informational traffic is not the same as commercial traffic, although in a report they look equally “nice”. Blog articles build reach and visibility, but not every user who reads them is immediately looking for a provider or product. The question is whether they go further after reading. That is why it is necessary to check transitions to the offer, case studies, solution comparisons, pricing or contact. If that transition does not happen, SEO generates valuable content reach, but not yet demand for the service.
In paid campaigns, traffic quality is most often derailed by three things. Too broad targeting, a poorly matched ad message and a weak landing page. A user will click if the promise sounds attractive, but will drop off quickly if, after landing, they do not see a clear offer, price, benefits, trust signals or a simple contact path. And that is the crux of it. Analysing the cost per click alone or the number of sessions from ads is simply too weak to make budget decisions.
Segmentation also matters. Without it, it is easy to confuse effect with coincidence. It is worth breaking down brand and non-brand traffic separately, new and returning users, devices, locations and specific landing pages. The same ad budget can perform well on desktop and poorly on mobile, or deliver sensible leads only in a chosen region. Such analysis makes it possible to cut channels and creatives that generate cheap but useless traffic.
There is one more catch: today’s data is less complete than it was a few years ago. Cookie consent, script blocking, browser limitations and tagging errors can distort the picture of effectiveness, sometimes subtly and sometimes painfully. That is why, in practice, properly implemented events, call tracking, data from forms and CRM, and regular filtering of bots, spam and internal traffic are becoming more important. Without this, it is easy to treat as effective actions that improve the dashboard but not the business result.
Current challenges in interpreting analytics data
Today’s challenges in interpreting analytics data mainly stem from the fact that traffic data is less complete and extremely easy to misread. Cookie consent restrictions, script blocking, browser restrictions and changes in attribution mean that part of the user journey is simply not fully visible. What does this mean in practice. A drop or increase in reports does not always mean a real change in interest in the offer, but rather a change in the way the user is “seen” by analytics. Incomplete data does not automatically mean poor marketing performance, but it does require more cautious interpretation.
The second problem is confusing high traffic with traffic that makes sense. Visits from educational content, social media or broad campaigns can boost the number of sessions, while adding not a single meaningful enquiry. This happens especially often when channels are reported together: without separating informational visits from commercial ones and without checking which subpages users go on to next. The question is whether you are measuring demand or just curiosity.
The quality of the measurement itself also matters a great deal. Poorly tagged UTM campaigns, duplicate events, lack of tracking for phone calls, multi-step forms or chat can completely distort the picture of a channel’s effectiveness. And then the number theatre begins: “activity” rises, but business does not. If measurement does not cover the key contact points with the offer, the report shows activity, but it does not show intent.
An additional challenge is filtering out low-quality traffic. Bots, referral spam, internal company traffic, accidental mobile clicks and visits from outside the service area can inflate metrics that at first glance look great. But be careful: “great” does not mean “honest”. That is why it is better to segment data at least by device, location, new and returning user, and landing page type. Only then can you see what is demand and what is noise.
In practice, however, the hardest thing is assessing whether a lead was truly valuable. In services and B2B, sending a form alone is not enough, because the enquiry may be outside the target group, outside the budget or about a different service. The problem is that the dashboard likes simple numbers, while sales lives off the quality of conversations. Without a shared definition of a valuable lead between marketing and sales, it is easy to optimise traffic that only looks good in the dashboard.
Stages of the process of identifying valuable traffic on the website
The stages of the process of identifying valuable traffic on the website begin with defining intent signals and end with connecting analytics to CRM and optimising sources of visits and subpages. Simply put: the point is to distinguish a user who is only consuming content from a user who is genuinely considering contact, purchase or sending an enquiry. Look at it another way: a session is statistics, while behaviour is a clue. The most important thing is to move from looking at sessions to looking at specific behaviours close to the decision.
- 1. Establish what real interest in the offer means in your model. For one company it will be a visit to the pricing page and starting a form, for another a click on the phone number, signing up for a demo or adding a product to the basket. Without this definition, you cannot sensibly assess traffic quality, because instead of intent you are counting cases. And that is not a cliché.
- 2. Set out micro- and macro-conversions. Micro-conversions show growing intent, for example moving from the blog to the offer, clicking a CTA, downloading a resource or opening a form. Macro-conversions confirm readiness to act, i.e. sending an enquiry, booking, calling or making a purchase. Do not confuse one with the other, because that is a straight path to “optimising” for clicks.
- 3. Organise technical measurement. Configure events, goals, tracking for forms, calls, chat and clicks on the most important elements of the page. Also fine-tune the details: whether campaigns have correct UTM parameters and whether events are being counted twice. Otherwise, analytics will look precise, while underneath it will remain a system error.
- 4. Segment traffic by source and intent. Separate the analysis: branded traffic, non-branded, paid, direct, referral, social and email. The same channel can deliver a completely different quality depending on the query, creative and landing page.
- 5. Assess the quality of the landing page. Check whether the page content delivers on the promise from the advert or search result, whether the CTA is actually visible and whether the form does not create too high a barrier. Often the problem is not traffic, but the page, which instead of guiding the user further, loses them along the way.
- 6. Analyse the paths between pieces of content. The most revealing are sequences such as article, offer, pricing, contact or advert, landing page, form. These show whether the user is moving from general curiosity to the commercial stage.
- 7. Compare behaviour with lead quality in CRM. Mark enquiries as valuable, unsuitable, duplicate, spam or outside the target group. Then you can see not only which channels generate leads, but which ones actually deliver sales opportunities.
- 8. Finally, optimise budget, content and UX. Cut back on sources and subpages that generate cheap but empty traffic. Instead, strengthen the channels, keywords and landing pages that more often end in offer-related actions and high-quality enquiries.
In a well-structured end-to-end process, the outcome is not one metric, but a map of dependencies between the source of entry, the type of intent, on-site behaviour and the sales effect. It is this that drives decisions, not the other way round. The question is: which content should be developed, which campaigns should be narrowed, where should the form be pared down, and where should the offer messaging be repositioned. Without combining marketing data with feedback from sales, it is impossible to reliably identify which traffic is truly valuable.
Most important practices in traffic segmentation and optimisation
The most important practices in traffic segmentation and optimisation start with dividing visits by intent, source, landing page and the quality of actions taken after entering the site. The acquisition channel alone says too little if you do not know which subpage the user landed on and what they did next. A visit to a guide is weighted differently from a visit to the offer, pricing, purchase FAQ or contact form. The most useful segmentation shows not only where the traffic came from, but whether it moved from the stage of general interest to the commercial stage.
In practice, analyse brand, non-brand, paid, direct, social, referral, e-mail and returning users separately. Add segmentation by device, location and type of entry page. This kind of breakdown quickly exposes which campaigns and keywords attract people with a real need, and which mainly generate superficial page views.
Good standard. Traffic quality is worth assessing at the level of a specific landing page, not just an entire source. The same channel can perform brilliantly for one service and disappoint for another, because the key is matching the message, offer and CTA to the intent of the visit. If traffic lands on the site but does not move on to the offer, the problem is often not the channel itself, but the misaligned landing page.
Optimisation makes sense when it looks at sequences of behaviour, not just the final conversion. Let’s look at it differently. Did the user move from the article to the offer, click the CTA, start the form, return to the site, or visit several sales subpages. When micro-actions increase but enquiries do not, the issue is that it is no longer the channel that needs checking, but the offer, the form, the way price is presented, trust elements and mobile usability.
Without connecting the data, we will not get very far. Effective optimisation requires combining analytics with CRM and sales feedback, because only then can you see whether a lead from a campaign was valuable, accidental, duplicated or outside the target audience. Without such a connection, it is easy to increase traffic that looks good in reports but brings no real business value.
Finally, there is data hygiene. Measurement needs to be cleaned regularly to remove noise, because bot traffic, referral spam, internal visits, incorrect UTM tags and accidental mobile clicks can completely distort the assessment of effectiveness. First proper measurement, then conclusions and budget decisions.
Typical mistakes and limitations in assessing lead quality
Typical mistakes and limitations in assessing lead quality start rather prosaically. Companies analyse forms alone, without sales data, add measurement errors to that, and lack a shared definition of a valuable enquiry. Marketing reports the number of leads, while sales evaluates them by a completely different measure, so a classic antithesis is created. The traffic looks good, but the sales team does not see a real impact on results.
A common mistake. Treating every contact as a success. A form may be submitted by someone outside the company’s service area, someone too early in the decision stage, or a user looking for something other than the actual offer. A lead has value only when it matches the target audience and has a real chance of moving further through the sales process.
The second problem is less spectacular, but more insidious. It is data limitations. Cookie consent, script blocking, attribution changes and the lack of full tracking for phone calls or multi-step forms mean that some valuable interactions do not make it into reports. The data clearly shows that a low number of visible conversions does not always mean low interest in the offer, but sometimes simply incomplete measurement.
When assessing lead quality, it is also easy to confuse volume with usefulness. Broad campaigns, educational content and social media can deliver plenty of contacts, but ones with poor fit. By contrast, a channel with a smaller number of enquiries can be better because it reaches people who are more decided and closer to a purchase decision.
Time can also be a hard limitation. In B2B services and with higher-value offers, users rarely decide after one session, so judging quality on the basis of a short attribution window simply can distort the picture. If a company looks only at the last click, it often underestimates the channels and content that previously built intent.
Sales adds its own filter to this. A salesperson can reject a lead as “weak”, even though in practice the fault lay with a response that came too late, a lack of follow-up process or an inconsistent offer, rather than the source itself. Who is really assessing quality then, the lead or the company’s reaction. That is why it is better to classify leads in CRM according to clear categories, such as valuable, unsuitable, spam, duplicated or outside the target audience, and to regularly compare this classification with traffic source data.
Key metrics for monitoring interest in the offer
The metrics that matter are the ones that show movement towards a decision. They reveal the user’s transition from the browsing stage to the contact, enquiry or purchase stage, rather than just “presence” on the site. The number of sessions, users and page views alone does not answer the question of whether the offer is attracting the right people. In practice, you need to track actions on offer pages, pricing, purchase FAQ, the form and the contact page. The most useful are metrics close to intent, not just metrics describing general traffic.
First, let’s check whether the user actually reaches the place where sales begin. This mainly means visits to the offer, transitions from educational content to the offer, pricing page views, solution comparisons, case studies and contact. If the blog generates high traffic, but users do not move on to commercial subpages, then interest in the offer is at most indirect.
- share of sessions with entry to offer pages and pricing page,
- clicks from articles or campaigns to the offer,
- clicks on the CTA, phone number, e-mail or chat button,
- starting and completing the form,
- users returning to the offer in subsequent sessions,
- number and share of macro-conversions: enquiries, demos, bookings, purchases,
- share of leads qualified in the CRM as valuable.
Let’s not omit indirect indicators either, that is, micro-actions that usually precede contact. This group includes, among others, starting a form, clicking a CTA, expanding the price section, downloading a resource, signing up for a consultation or going to the contact page after viewing the offer. Micro-conversions do not replace sales, but they show well whether traffic is maturing towards a decision.
Not every lead carries the same weight. And this is not a cliché, but everyday reality in reports. If a campaign collects a mass of forms, and most submissions are outside the target audience, from the wrong region or concern a different service, then it looks great on the chart, but in the business things go quiet. The question is: how much of this is actually suitable for sales to work on. That is why, alongside conversions, it makes sense to report the share of leads accepted by sales, the percentage of rejected leads, and the sources that most often deliver valuable enquiries.
Numbers in a single row can be misleading. These metrics need to be broken down into segments, not thrown into one aggregate table, because only then do you see what really works. It is worth comparing branded and non-branded traffic separately, new and returning visits, mobile and desktop, as well as specific landing pages. The same channel can look good in overall terms, but weak at the level of a specific service or a specific entry page. But beware, it is precisely these “weak” areas that usually drain the budget quietly.
A dashboard only makes sense if it tells the truth. In practice, a good dashboard should not end with CTR, bounce rate or average time on page, because these are often convenient metrics rather than decisive ones. It says far more about the relationship between entries to the offer, CTA clicks, form starts, enquiry submissions and the later assessment of the lead in the CRM, that is, the whole chain from interest to contact quality. Only such a data chain shows whether traffic is really working towards results or just boosting visit statistics.
FAQ
Frequently asked questions
How can you assess whether site traffic is really interested in the offer?
You need to look not at the number of visits alone, but at behaviours closer to a decision: moving on to the offer, pricing, contact details, CTA or form. A visit to a how-to article usually carries a different weight than a visit to a service page.
Does a high time on site mean greater interest in the offer?
Not necessarily, because a user may simply be reading the content out of curiosity. The key is actions that show an intention to contact or buy, not just time spent on the site.
Why do you need to separate informational traffic from commercial traffic?
Because both types of visits can look good in reports, but they indicate different intent. Without this, it is easy to treat traffic that delivers content reach but does not create demand for the service as effective.
When are micro-conversions more important than the number of sessions?
When you want to assess whether interest in the offer is growing, not just whether visits are increasing. Micro-actions such as visiting the offer page, clicking the CTA or starting a form show the first step towards contact.
What does it mean when micro-actions are increasing but enquiries are not?
Most often the problem lies in the offer, the CTA, the form, trust or the match with the traffic. It is a signal that users are taking the first step, but not moving on to the final action.
What CRM data helps assess lead quality?
It is worth comparing enquiries with information on whether they were valuable, irrelevant, duplicated, spammy or outside the target group. Only then can you see which channels generate real sales opportunities and which only create activity in reports.