

The board usually does not need a full marketing dashboard. It needs a few numbers that allow decisions on budget, priorities and the risk to the plan. That is why a board report should show whether marketing is really delivering revenue growth, improving pipeline quality and keeping costs in check. Data on traffic, reach or the number of leads is rarely enough if it cannot be tied to sales and margin. The most important change is to start reporting from the board’s business questions, not from the metrics available in marketing tools. In practice, that means fewer indicators, but more accurately chosen and calculated according to the same rules. That model is simply more useful than an extended campaign report, because it leads to decisions, not slides with data.
What is a practical reporting model for the board?
A practical reporting model for the board is a way of showing how marketing contributes to business results, rather than another set of campaign statistics. Such a model translates marketing activities into revenue, acquisition cost, sales opportunity quality, retention and the risk of delivering the plan. The board does not evaluate marketing on CTR or the number of clicks, but on whether the budget delivers a predictable outcome.
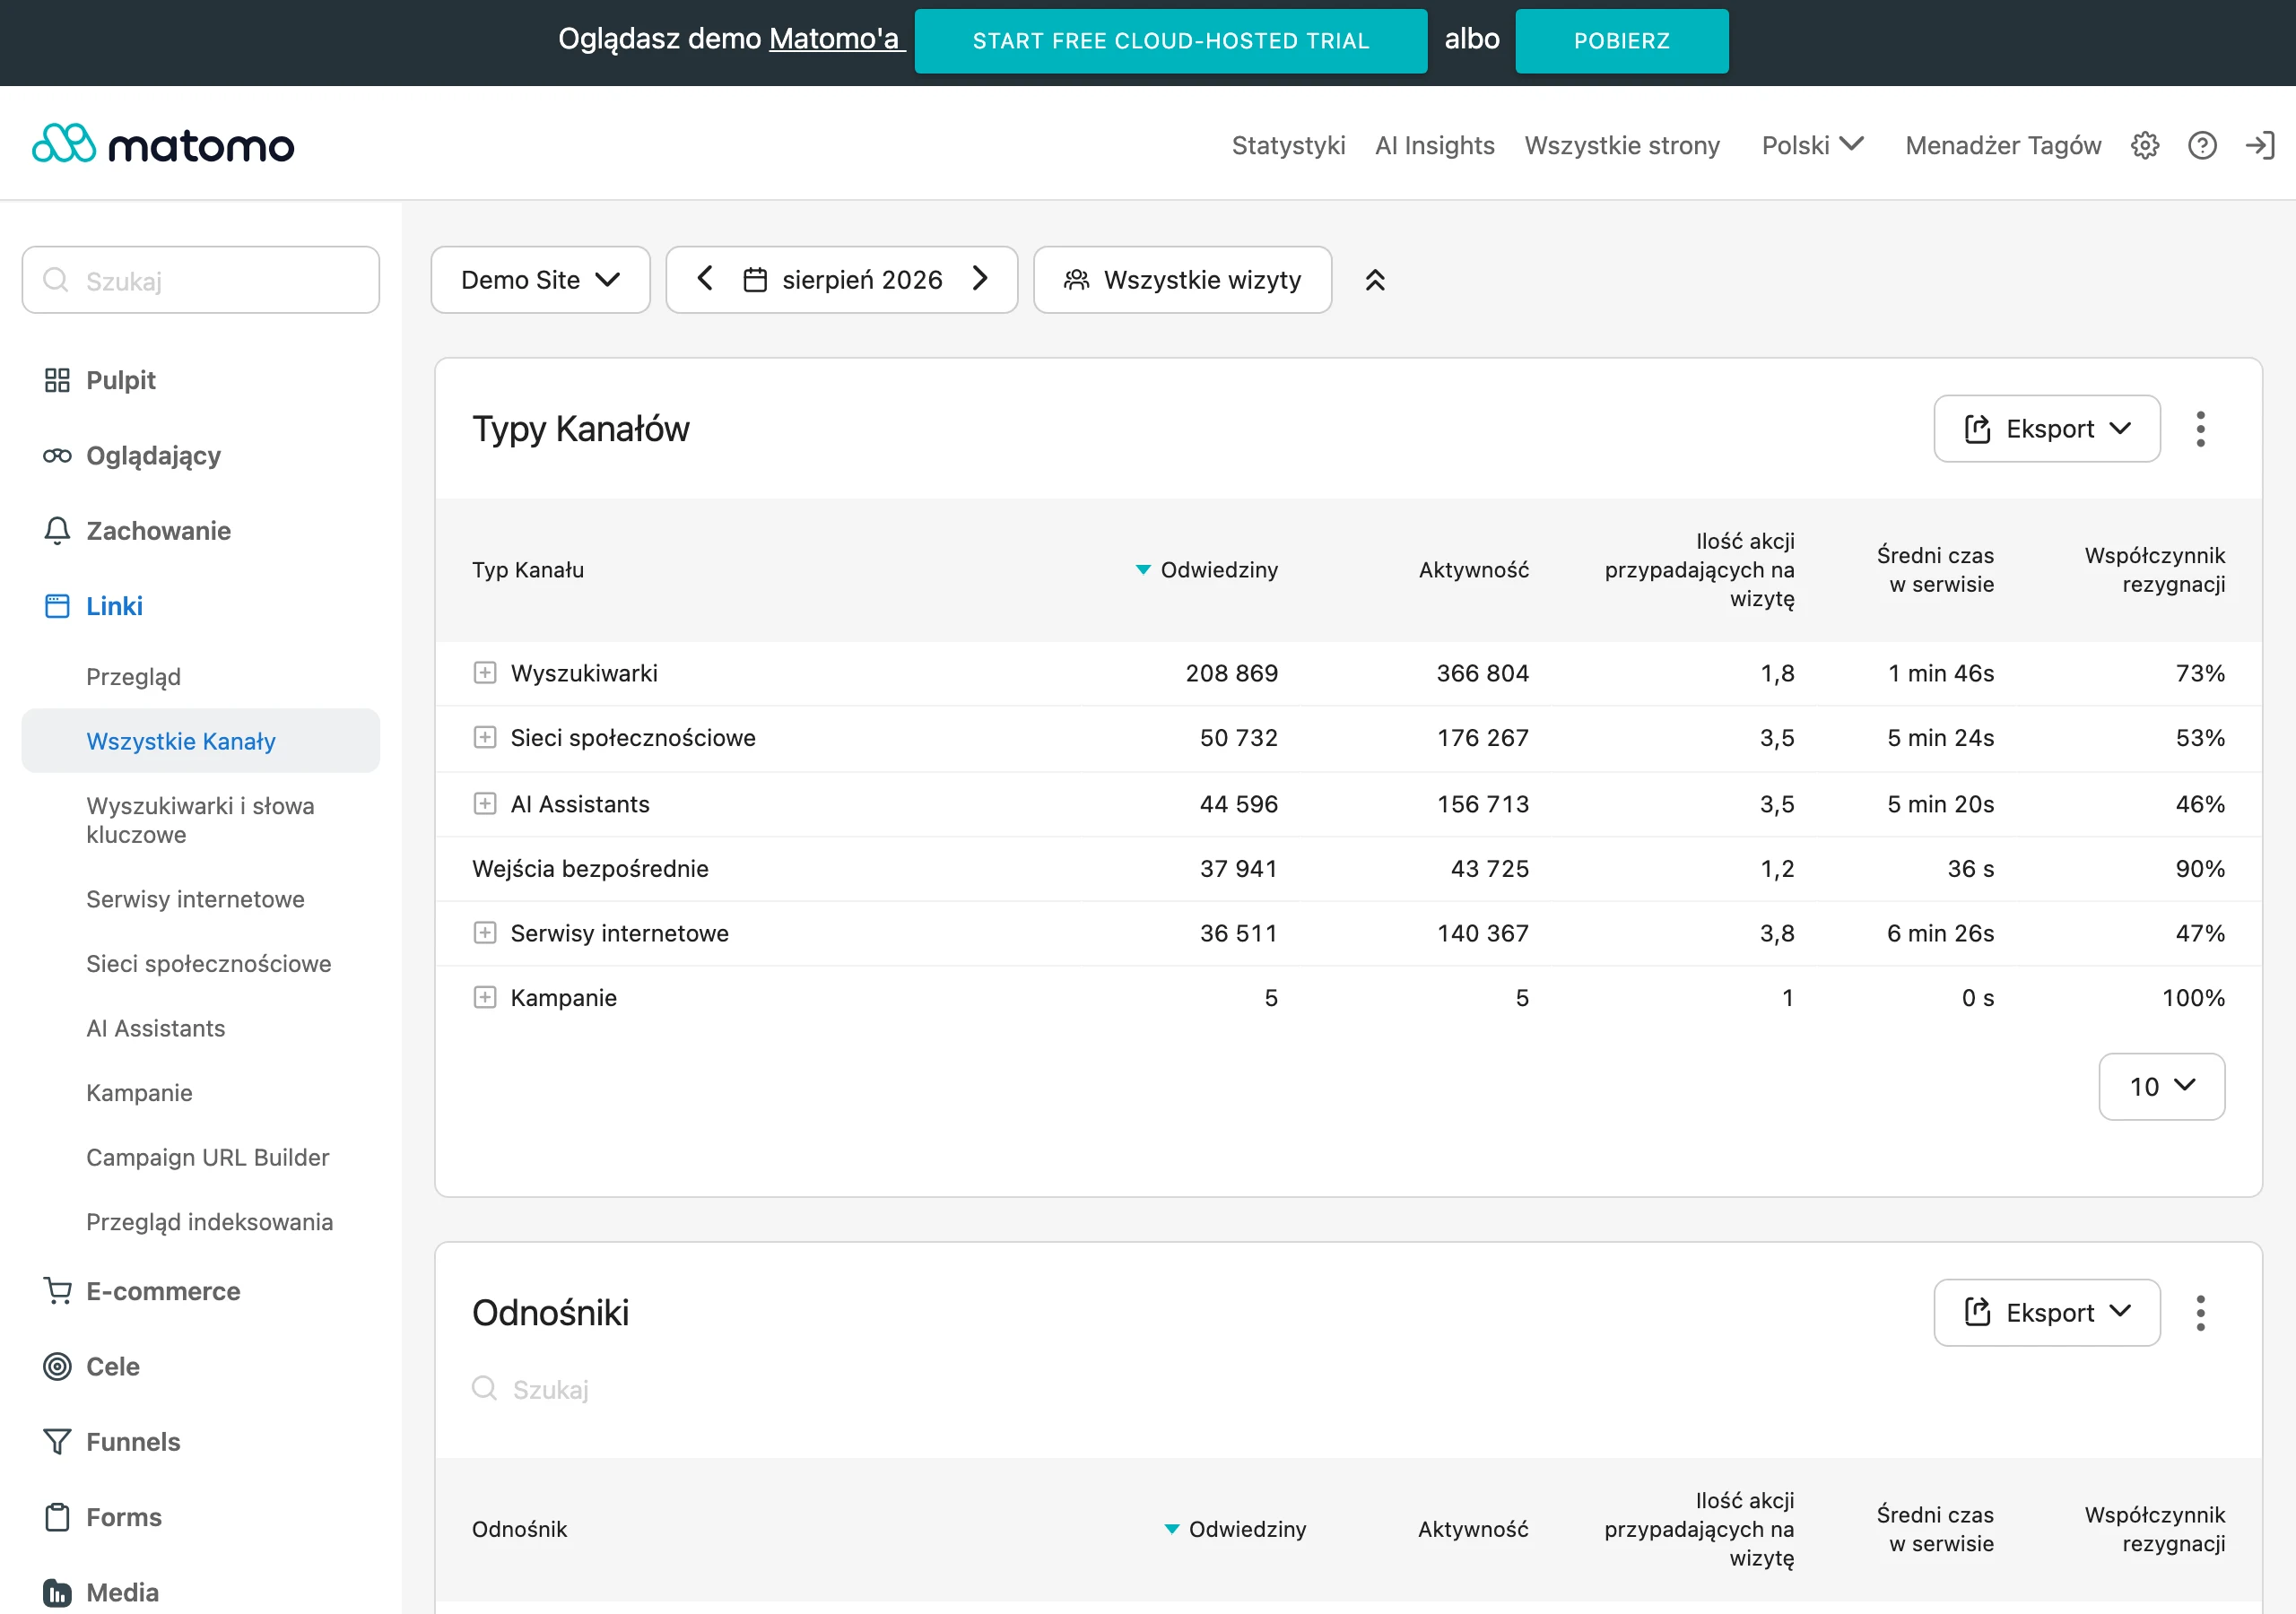
In a well-built model, every metric answers a specific management question. The example is simple, and even brutally practical: if the board asks whether it is worth increasing the budget, the report should show the impact of additional spend on pipeline, sales and acquisition cost. When the question concerns the risk to quarterly performance, the focus shifts to the speed of movement between funnel stages, opportunity quality and the length of the sales cycle. And there is no room for decoration here; what matters is the cause-and-effect relationship.
Such a model has several fixed elements: the business objective, the management question, the primary metric, supporting metrics, the data source, attribution rules, the segment and the reporting period. The key point is that without common definitions even correct numbers can mislead. If the company does not have one definition of MQL, SQL, opportunity or acquisition cost, the board report quickly loses credibility. And then the discussion shifts from decisions to a dispute over words.
The biggest difference between a board report and a report for the marketing team concerns the level of detail. The board looks at result, trend and risk, while the marketing team looks at channels, creatives, tests and operational optimisation. Channel metrics are needed only when they explain a change in business results, for example a fall in lead quality or an increase in CAC. Instead of describing “what we did”, the report should explain “what that changed”.
In practice, the best management report usually has three layers. First it shows the business result and the variance against plan, then the drivers of change, and finally the recommended decision. This reverses the typical reporting logic: you do not start with channels, but with marketing’s impact on the company’s goal. And that is not a cliché, but a structure that saves time and nerves in the boardroom.
Which marketing indicators are key for the board?
The board does not live on clicks. It lives on metrics that show marketing’s impact on revenue, budget efficiency, pipeline quality and the predictability of results. In practice, that means a few overarching metrics rather than a long list of data from ads, the website and social media. The question is simple: does marketing deliver valuable demand, how much does it cost, and can that result be repeated.
- Revenue attributed to or supported by marketing — shows whether marketing participates in a real sales result, rather than only generating activity.
- Pipeline value originating from marketing — tells you how many sales opportunities marketing brings into the funnel and whether their value is sufficient against plan.
- CAC, or customer acquisition cost — allows you to assess whether growth is being achieved efficiently, not at the expense of excessively high costs.
- Lead-to-customer conversion or movement between stages — shows the quality of the demand acquired and whether leads actually turn into sales.
- Time to close and funnel velocity — help assess when marketing will translate into results and where delays arise.
- Retention, churn or the share of repeat purchases — are crucial where customer value depends not on the first transaction, but on a longer relationship.
Which of these indicators will matter most depends on the business model. In lead generation companies, the board usually looks primarily at marketing sourced pipeline, marketing influenced revenue, customer acquisition cost, average opportunity value and closing effectiveness. In e-commerce, the emphasis shifts elsewhere: revenue after marketing costs, contribution margin, new customer acquisition cost, share of new customers and the quality of purchasing cohorts. Rather than one “holy” KPI — a set matched to the mechanics of the business.
In a subscription model, it becomes even sharper. CAC, payback period, retention, churn and expansion revenue move to the foreground, because the price of the first sale alone is not enough when new customers drop off quickly or have low lifetime value. And the facts are these: From the board’s point of view, a more expensive channel with better retention is better than a cheap channel that delivers low-quality customers. Cheapness does not win; durability does.
It is also necessary to distinguish lagging indicators from leading indicators. Lagging indicators show the end result, for example revenue, CAC or post-marketing cost margin. Leading indicators make it possible to assess earlier what will happen in a few weeks or months, for example pipeline quality, stage conversion rate, the share of high-value segments or the cost of qualified demand. In other words: some say “what came out”, others “what will come out shortly”.
More and more often, management buys into metrics detached from CRM and finance. Sessions, page views, reach or the number of leads alone do not answer the question of whether marketing is genuinely supporting company growth. The key is linking this to revenue and profitability, not movement on a chart. If a metric does not help assess revenue, profitability, pipeline quality or plan risk, it is usually not a management indicator.
The most common mistake has banal consequences. Operational metrics end up in the report for management instead of management metrics. CTR, CPC, CPM, frequency and test results are needed by the marketing team, but for management they only start to mean anything when they explain a change in acquisition cost, opportunity quality or sales levels. Otherwise they are just numbers that sound clever but settle nothing. That is why, in practice, it is better to start with 5-8 main indicators and only then build a diagnostic layer beneath them.
How does building a set of indicators for management work?
This is meant to be a compass, not a dashboard. Building a set of indicators for management means translating the company’s goals into a few numbers that show the result, the cause of the change and the decision needed. The process does not start with Google Analytics, CRM or ad platforms. It starts with questions: is it worth increasing the budget, which segment is growing most healthily, where is the funnel breaking down and is the revenue plan at risk? The question is whether the indicator leads to a decision or only to discussion. If an indicator does not help answer a specific management question, it usually should not go into the main report.
Then a simple metric tree is put together. At the top is the business goal, for example revenue growth or improved margin, rather than a list of charts to browse “along the way”. Beneath it appear indicators showing what drives that result: pipeline value, sales opportunity quality, stage-to-stage conversion, acquisition cost and retention. The key is that this structure shows relationships, not just the outcome. As a result, management sees not only the end result, but also the place where the problem appears.
Next, leading indicators are selected and separated from diagnostics. The first group usually includes revenue attributed to or supported by marketing, pipeline value, CAC, payback, conversion to customer or retention, i.e. what says “how things stand”. The second group includes explanatory metrics such as the cost of acquiring a qualified lead, the rate of MQL to SQL progression or time to close, i.e. what says “why”. And that is not a cliché. Management should see the business effect first, and only then the indicators that explain its change.
This is where the difficulties begin. At this stage, definitions and data sources are organised, because without a single definition of MQL, SQL, opportunity, revenue, returns or marketing cost, the report quickly becomes inconsistent and open to “creative” interpretations. In practice, it is worth checking campaign tagging, duplicate leads, completeness of fields in CRM, the method of calculating media and tool costs, and the consistency of reporting periods. Data speaks clearly if you first take care of its hygiene. This is exactly where the mistakes most often arise, and later they look like a marketing problem, even though they are a data problem.
Finally, a simple logic for assigning marketing impact is established. In many companies, a sourced, influenced or stage-based CRM model works better than trying to show perfect attribution for every click, because that “perfection” often ends in a dispute over details. Management usually trusts consistent trends, cohorts and funnel stages more than complicated charts from advertising platforms. Look at it differently: the model should be defensible in the room, not only in a spreadsheet. It is better to have a simple attribution model that everyone understands than a more accurate one that no one can defend in a meeting.
A good management view has three layers. The first is the business result, the second — the drivers of change, the third — the recommended decision. If revenue deviates from plan, the report should not start with channels, because that distracts from the essence. First you show the scale of the deviation, then you break it down into demand volume, pipeline quality, sales conversion, cycle length and acquisition cost, and only at the end do you say plainly what to do about it. This structure shortens the path to a decision and cuts out fruitless disputes over metrics that do not deliver the result.
At the end, there is the cyclical review. And that is a good thing, because a set of indicators is not carved in stone. When the company changes its growth model, enters a new segment or shifts from an acquisition focus to a retention focus, the report also needs to switch to different emphases. A well-built set of indicators is not a presentation of data, but a tool for correcting the plan.
What business decisions do marketing indicators support?
Marketing indicators make sense when they support decisions. Specifically: budget, segment priorities, channel mix, sales forecast and the risk of delivering the plan. Management does not look at them to judge whether a campaign was “interesting”, but to decide where to add investment, where to cut it and what to expect in the coming months. The key, then, is those metrics that connect marketing with revenue, margin and the predictability of results.
The first group of decisions concerns budget allocation. If marketing sourced pipeline is growing, CAC remains under control, and cohorts of new customers maintain quality, management gets a clear signal: spending can be increased. But note that growth in the number of leads alone is not yet a reason to celebrate. If conversion to sales is falling or the close cycle is getting longer, the right decision is often to reduce scale and improve demand quality, not to turn the budget up further.
The second group is decisions about channels and segments. Data on pipeline value, average deal size, win rate and retention show which traffic sources or customer groups are genuinely profitable, and which merely look good in a table. In practice, it may turn out that a channel delivers cheaper leads, but customers with lower value or higher churn. From the board’s perspective, a cheaper lead is not a success if it ends up with weaker margin or poorer retention.
The third group of decisions concerns forecast and plan risk. In companies with a long sales cycle, it is not just the end metrics that matter, but also leading indicators: stage-to-stage velocity, the share of high-value segments, the quality of new opportunities and time to close. These show whether the current pipeline will deliver the plan next quarter, before the result has a chance to “fall apart” in P. and L. When these metrics start to deteriorate, the board can adjust targets, budget or sales expectations earlier.
The fourth group is decisions about the balance between acquisition and retention. And this is where it gets interesting. In e-commerce and subscription models, the cost of the first transaction alone can muddy the picture more than clarify it. Metrics such as revenue after marketing cost, payback, share of repeat purchases, cohort retention and revenue churn work much better. These numbers set priorities: do we keep investing in acquisition, or do we instead refine the experience and retain existing customers.
Metrics are also useful in organisational decisions. In short, they can identify the bottleneck. If marketing delivers lots of MQLs, but they convert poorly into SQLs and opportunities, the problem does not have to lie in the campaigns. It may be in the definitions, the sales process or the quality of lead handover. In that case, the decision is not “let’s change the creatives”, but to adjust collaboration between marketing and sales, define the stages in CRM more clearly, or change the qualification criteria. Good metrics not only evaluate marketing, but also show where growth is actually being blocked in the company.
The greatest value lies in metrics that end with a concrete business action. Simple. If, after looking at the report, it is still not clear whether to increase investment, change the segment, improve the funnel or adjust the plan, then the report is either too operational or spread too thinly in every direction. The question is: does this document shorten the distance between numbers and decision. A report for the board should shorten the path from data to decision, not multiply questions about campaign details.
What should you pay attention to when reporting metrics to the board?
When reporting to the board, you are primarily showing marketing’s impact on business results, plan risk and the decision that needs to be taken today. No embellishment. The board does not need the full picture of the marketing team’s work, only a brief answer to three questions: what changed, why and what are we doing about it. And this is not a cliché. A good management report starts with the deviation from target, not with data from channels.
The most important thing is consistency of definitions. Full stop. If one time “acquired customer” means the first transaction and another time a signed contract or activation, the figures stop adding up and cannot be fairly compared. The same applies to MQL, SQL, opportunity, revenue, returns, cancellations and marketing costs. Without a single definition, a metric looks precise, but it is not suitable for decisions.
The report should bring together data from several sources, not rely solely on the advertising platform or web analytics. Otherwise, you are looking at a shadow, not the object. In practice, you need at least a combination of costs, user behaviour, CRM stages and financial data. Only then can you sensibly show acquisition cost, pipeline quality and the real impact on revenue.
First, separate lagging indicators from leading ones. The former tell you what outcome has already happened, for example revenue, CAC or margin after marketing cost. The latter suggest what may happen in a few weeks or months, for example stage progression speed in the funnel, the share of profitable segments or the quality of new cohorts. It is precisely leading indicators that give the board a chance to react before the problem, rather than only after the fact.
Equally important is how you present attribution. In many companies it is not possible to fairly assign every sale to one channel, especially with a long buying cycle and many touchpoints. And why pretend to have apothecary-level precision. It is better to adopt a simple, readable rule, for example sourced, influenced or a model based on CRM stages, than to build a seemingly exact report that nobody believes.
The report should be short. And layered. On the first screen or first page, you should place the headline metrics, the trend, comparison with plan and the recommendation, without going into detail. Only below that should you add explanatory metrics, such as stage conversion, qualified demand cost or the share of channels in the highest-value segments. If the report does not lead to a decision about budget, segment priority or plan correction, it is too operational for the board.
What are the most common mistakes in reporting marketing metrics?
The list of mistakes is surprisingly repetitive. Most often, volume is reported instead of quality, operational metrics are mixed with management metrics and indicators are calculated on inconsistent data. Growth in traffic, reach or the number of leads on its own rarely answers whether marketing is actually improving the company’s performance. The board mainly looks at customers, pipeline, revenue, acquisition cost, retention and predictability, because that is where the truth is visible, not the “noise”.
The first classic mistake is showing leads without information on what happens to them next. A large number of contacts looks great only until sales shows low quality, a long closing time or a weak win rate. A lead is therefore the beginning of the story. Not its conclusion.
The second mistake is putting channel metrics such as CTR, CPM, CPC, frequency or number of followers into a management report without linking them to business results. These metrics are needed by the marketing team to optimise campaigns and for day-to-day work. For the board, they only start to matter when they explain a change in CAC, pipeline quality, margin or revenue. The question is what follows from this.
The third mistake is the lack of a single cost methodology. If CAC does not include all material expenses, for example tools, team labour, creative production, commissions or agency costs, the metric can be artificially understated. And then decisions about scaling budget are based on the illusion that the channel is more profitable than it really is. The data make it clear that this is how costly disappointments are built.
The fourth mistake is too much faith in attribution accuracy. In practice, some contacts get lost between systems, channels overlap, and offline data is simply often patchy. It is better to honestly show trends, cohorts, marketing’s share of pipeline and changes in conversion between stages than to pretend that every revenue item can be attributed to a single click with surgical precision.
The fifth mistake is an overloaded dashboard. When a report has dozens of metrics, the board gets a wall of numbers, but no answer as to what the priority is. 5-8 top-level metrics and a thin diagnostic layer work much better than an overbuilt cockpit without hierarchy.
The sixth mistake is a lack of segmentation. The average for the whole company can hide both a problem and an advantage, because it conceals differences in the segment, channel or customer cohort. Result. You can then wrongly cut the budget of a channel that works brilliantly in a high-margin segment, or vice versa: overestimate a channel that delivers cheap but low-quality demand.
The last mistake is reporting a one-off snapshot instead of a trend. One month can be distorted by seasonality, a budget shift, a change in offer or simply the sales team’s work. The question is what this means over time. That is why marketing metrics should be shown as a trend, against plan, with a short comment on what was a structural change and what was only a temporary deviation.
What tools support effective reporting to the board?
Effective reporting to the board is supported primarily by four classes of tools: CRM, web analytics, advertising platforms and a BI layer connecting the data. Each of them shows a different slice of reality, so only together do they provide a picture that makes sense in a conversation about money. CRM reveals pipeline, sales stages and revenue, web analytics shows sources and behaviour, advertising platforms deliver costs and reach, and BI combines it all into a single board report. What matters most is not which tool you choose, but whether the data from it can be linked to the business result.
CRM is usually the most important system if the company sells through salespeople or has a longer buying cycle. That is where the definitions of MQL, SQL, opportunity, won sale and deal value should sit. Without CRM it is hard to credibly show lead quality, the speed of movement between stages and whether marketing is truly feeding the pipeline rather than just producing contacts.
Web analytics is needed to understand where traffic comes from and how users behave before conversion. By itself it will not deliver a board report, because it usually does not see the whole sales process, returns, cancellations or final margin. Its role is supportive: it is meant to explain the change in result, not replace revenue data.
Advertising platforms are needed to keep spending in check. However, they cannot be the only oracle when we are talking about marketing effectiveness. They show cost, clicks, conversions reported by their own system and campaign results, but their attribution can be overstated or simply incomplete. The key is what you use them for. In practice, they work very well when you are analysing a given channel, not when you want to use them to “close” marketing’s impact on sales.
A BI layer or data warehouse comes into play when the company wants to report consistently and on a regular basis. This is the moment when spreadsheet juggling ends and a single, consistent version of the numbers begins. That is where data from CRM, analytics, ads and finance are combined, one logic for calculating CAC, revenue, pipeline and retention is established, and a board view is built. The data make it clear: if margin after marketing cost, payback, churn or cohort quality are to appear in the report, without such a layer inconsistencies quickly creep in and the discussion becomes sterile.
In e-commerce and subscription businesses, transaction, billing or ERP systems are equally important. Without them, the report is like a receipt without a receipt slip. They provide information on orders, returns, cancellations, renewals and actual revenue recognised in accounting, that is, what actually “stays” in the company. If the report ends with the first transaction, the board sees only acquisition cost, but not customer quality.
At the start, you do not always need to build an elaborate technology stack. Instead of hunting for another tool, it is better to close the basics first. In many companies, a well-organised CRM, correct UTM parameters, a regular export of costs and a simple dashboard in BI or even in a spreadsheet are enough, as long as the definitions remain fixed. The problem is that most often technology is not what is missing. What is missing is data ownership, proper campaign naming and one definition of the same metric.
When choosing tools, slogans do not matter, only practice. And that is not a cliché. Let’s look at it differently: can the data be pulled automatically, does the system keep a change history, is it easy to separate segments, and can the report be built for management rather than for channels. The question is whether the report answers decisions or just looks good. A good board reporting tool should answer three questions: what is the result, what changed it and what decision follows from it.
FAQ
Frequently asked questions
Which marketing metrics really interest the board?
The ones that matter most are those that show marketing’s impact on revenue, budget efficiency, pipeline quality and outcome predictability. In practice, these include marketing-sourced revenue, pipeline value, CAC, conversion to customer, time to close and retention.
Why does the board not need a full marketing dashboard?
Because it needs a few numbers to make decisions on budget, priorities and plan risk. An overcomplicated report often shows lots of data, but does not lead to a specific decision.
What should a marketing report for the board show?
It should show whether marketing is driving revenue growth, improving pipeline quality and keeping costs under control. It is also useful if it includes variance to plan, the factors behind the change and the recommended decision.
When are channel metrics useful in a report for the board?
Only when they explain a change in business outcome, for example a drop in lead quality or an increase in CAC. On their own they are not enough, because the board looks first and foremost at impact, trend and risk.
Which metrics are most important in a lead generation company?
These are usually marketing sourced pipeline, marketing influenced revenue, customer acquisition cost, average opportunity value and closing effectiveness. These metrics show whether marketing is bringing valuable demand into the funnel and whether it can be effectively turned into sales.
Which metrics are key in a subscription model?
At the top of the list are CAC, payback period, retention, churn and expansion revenue. In this model, the price of the first sale alone is not enough, because customer lifetime value also matters.