
Defining the objective and research questions with AI
AI helps refine the objective and research questions by breaking a general problem into a set of specific, measurable questions. When you see a signal such as “retention is falling”, you can ask the model to clarify which cohorts are dropping out within 7 days and which events precede churn. It is a good idea to ask straight away for a list of hypotheses, observable variables and how to measure them in the data (e.g. events, transactions, logs). This approach shortens the path from intuition to a sensible measurement plan.
AI is particularly useful for formulating hypotheses that can be disproved, and for selecting success criteria. Ask directly which hypotheses are falsifiable and which metrics will disprove them, and the model should indicate the KPI, time horizon and minimum effect (MDE). For example, a hypothesis may read: “Introducing an onboarding checklist will increase activation from 28% to 32% within 14 days” along with a definition of the activation metric based on specific events. If you want the objective to be “testable”, also ask for a power analysis plan and the required sample size.
AI can also help you choose the right unit of analysis and granularity, which directly affects the conclusions and the choice of statistical tests. Data is analysed differently at the user, session, order or business account level, so it is worth asking what errors result from aggregation and how to detect them. The model should warn you, among other things, about Simpson’s paradox and suggest segmentation when averages mask the problem. For example, average ARPU may be increasing while it is falling in the new-user segment, which naturally steers the analysis towards cohorts.
AI also makes it easier to reduce disputes over definitions by preparing a glossary and metric definitions before you start calculating results. Common misunderstandings concern whether an “active user” means a login or a transaction, so it is worth insisting on clarity. Ask for a draft “metrics dictionary” with definitions, formulas and data sources (table/columns), so that the whole team calculates the same thing. Notion or Confluence work well for sharing and maintaining consistency, and drafts can be generated and iterated on in tools such as ChatGPT or Claude.
AI can suggest research methods matched to the questions, provided you clearly specify whether the problem is causal or predictive. It is worth asking: “Is this a causal or predictive problem, and what are the confounding risks?”, and the model should indicate whether an A/B test, cohort analysis, predictive model or qualitative research will be better. In causal inference, it can also suggest approaches such as propensity score, difference-in-differences or instrumental variables. This makes it easier not to fall into the trap of confusing correlation with causation.
AI makes it easier to translate a research objective into a real work plan if you ask for a step-by-step checklist with concrete deliverables. A pipeline format works well: collection → cleaning → EDA → tests → model → conclusions → recommendations, supplemented with constraints (time, budget, data access). To reduce hallucinations, use the prompt pattern: Objective → Data → Constraints → Expected outcome → Validation test, and ask what is certain, what is hypothetical and how to verify it in the data. When there are many hypotheses, the model can also help arrange an analysis backlog according to “impact vs effort” or “risk vs reward” and justify the priorities adopted.
- 01Refining the objectiveBreaking it down into specific, measurable questions.
- 02Generating hypotheses and variablesA list of hypotheses, variables and measurement methods.
- 03Formulating success criteriaKPI, time horizon, falsifiable metrics.
AI shortens the path from intuition to a sensible measurement plan by showing how to measure and disprove hypotheses.
Collecting data and source materials using AI
AI speeds up data and source collection because it helps you locate materials more quickly, plan downloads and prepare safe queries for systems. In literature research you can use tools such as Elicit, Semantic Scholar, Connected Papers or Lens.org to efficiently reach related papers and backward citations. A practical prompt is: “What are the 3 dominant approaches and their limitations?”, followed by checking the PDF abstract against the results and tables. This approach shortens the selection time, but it still requires checking the content in the original source.
AI also supports citation-based search, as long as you force answer verifiability. In Perplexity, You.com or “with browsing” modes, it is worth requiring: “provide the quote and source excerpt” and “publication date”, because incorrect attributions do happen. For numerical data, ask for at least 2 independent sources and compare metric definitions before drawing conclusions. If the model cannot indicate how to verify key claims, treat the result as inspiration rather than fact.
- API: AI helps write clients (e.g. requests in Python, httr in R), pagination, retry and handling limits; example sources include Google Analytics 4 Data API, Salesforce, GitHub API and public data (GUS, Eurostat, World Bank).
- Web scraping: AI makes it easier to work with Playwright/Selenium and CSS/XPath selectors, but you need to take the terms of service and robots.txt into account, as well as a “polite scraping” strategy (2–5 s delays, user-agent rotation, limiting concurrency).
- PDFs and documents: to extract tables and fields, use Tabula, Camelot, pdfplumber or services such as Azure Document Intelligence / Google Document AI, and catch OCR errors with validation rules and sample checks (e.g. 1–2% of records).
- Databases and warehouses: AI can generate SQL (BigQuery, Snowflake, PostgreSQL) and translate business logic into CTEs/windows, but it is worth enforcing sanity checks (row counts, duplicates, totals) and a “safe” variant (LIMIT, date filters).
AI makes it easier to integrate sources and design data collection when stable identifiers or events are missing. When joining data, the main obstacle is usually the lack of a fixed key (email, device_id, account_id), so it is worth asking about record linkage strategies: fuzzy matching (RapidFuzz), normalisation rules and assessing precision/recall on a manually labelled set; for company data, a combination of NIP/REGON + name with normalisation often works well. If there is too little data, the model can help lay out a tracking plan (GA4, Segment, Amplitude) with a minimal set of events, properties, naming convention (snake_case) and field types, and remind you about schema versioning and client-side event validation. In projects with public data and licences, AI can summarise the terms (CC-BY, ODbL, API terms of service), but the decision should be based on the original wording and you should keep a register of sources, versions and download dates (data lineage).
Data preparation: quality and feature engineering
AI supports data preparation for analysis by automating quality profiling, cleaning and suggesting sensible features for a specific problem. At the start, it is worth using tools for quality reporting and validation such as ydata-profiling, Great Expectations, Soda or Deequ for Spark to check distributions, missing values, duplicates and outliers. A good practice is to ask the model for a list of validation rules tailored to the domain (e.g. prices > 0, dates within range, unique key). This makes it faster to separate real phenomena in the data from data collection errors.
AI streamlines cleaning and normalisation because it can suggest specific rules and a way to document changes. Typical steps include trimming whitespace, standardising units (kg vs g), parsing dates (ISO-8601) and validating formats (e.g. postcodes), while for text data OpenRefine is useful for clustering similar values. For missing-value imputation, the model can match the method to the missingness mechanism (MCAR/MAR/MNAR), e.g. the median for skewed distributions, KNNImputer, IterativeImputer (MICE) or tree-based approaches, and for MNAR suggest adding a “missing” flag. Force a comparison of the impact of imputation on metrics (e.g. differences in mean, AUC) and a sensitivity report, instead of accepting one method “blindly”.
AI can also help with deduplication and entity resolution, provided you first clearly define what counts as a “duplicate” in your context. The model may suggest probabilistic matching (Splink) or a rule-based approach with fuzzy matching, as well as blocking rules for better performance, and then advise how to assess quality on a manual sample (e.g. 500 pairs). In feature engineering, AI usually accurately points to transformations and sensible variable sets such as RFM, rolling averages, 7/30-day trends or seasonality indicators, as well as techniques like log1p for financial values, standardisation and winsorisation of outliers. In prompts, it is worth explicitly requiring mention of leakage risk (e.g. a feature from the future), because that is a common cause of “too good” results.
AI also supports work with text and preparing data to operate at scale when large volumes and qualitative sources are involved. For surveys, tickets and reviews, it can propose a pipeline: cleaning, language detection, lemmatisation (spaCy/pl), embeddings (OpenAI text-embedding, SentenceTransformers), and then clustering (HDBSCAN) or semantic search. Topic quality is best checked manually on a sample (e.g. 100 random examples). If you need labels, the model can prepare a schema and instructions, and active learning directs manual labelling towards records with the highest uncertainty (often reducing the workload by 30–50%) in tools such as Label Studio, Prodigy or Snorkel. On the performance side, AI will suggest data formats and organisation (Parquet, Delta, partitioning by date, indexes) and the choice of tools (DuckDB/Polars locally, Spark/Databricks at scale), and for reproducibility it will propose repository standards, a checklist (seed, library versions, data snapshot, saved SQL and configuration) and point to tools for versioning and experiment tracking (DVC/LakeFS, MLflow).
- 01Automated profilingQuick assessment of quality, missing values and distributions.
- 02Validation and domain rulesAI suggests tests and correctness rules.
- 03Efficient cleaning and normalisationStandardising formats, removing errors.
AI speeds up the data preparation process, separating errors from real phenomena and improving the quality of analyses.
Exploratory analysis and statistics supported by AI
AI speeds up exploratory data analysis (EDA) and statistics because it makes it easier to choose charts, tests and segmentation tailored to the research question. In practice, you can ask the model to propose a set of visualisations: histograms, box plots, cohort charts, correlation heatmaps or control charts, and then make sure there is a description in the style of “what is this chart meant to show”. This will most often be work in Python (seaborn, plotly), R (ggplot2) or support in BI, e.g. Power BI Copilot or Tableau. As a result, EDA becomes a reproducible process rather than a collection of randomly chosen charts.
AI also helps segment users and formulate business conclusions when you ask about “customer types” and want to describe them in product or marketing language. The model can suggest features for segmentation (e.g. RFM, purchase categories, acquisition channels), choose an algorithm (K-means, GMM, HDBSCAN) and propose a way to choose the number of clusters (silhouette, elbow). It is worth specifying that you expect profiling of 5–7 segments with distinguishing features, rather than centroids alone. This makes it easier to translate segments into actions (e.g. communication, offer, product priorities).
AI can support the choice of statistical tests, provided that you ask it to check the assumptions and indicate sensible alternatives. You can get a recommendation between the t-test, Mann–Whitney U, chi-square, ANOVA, permutation tests or bootstrap, as well as a suggestion of what to do when there is no normality or independence. In business analysis, confidence intervals and bootstrap are often more informative than p-values alone. The safest approach is a prompt along the lines of: “check the assumptions, identify the risks and propose a plan for validation on the data”.
AI makes it easier to analyse retention, cohorts and anomaly diagnostics, because it suggests definitions, sensible cuts and a triage plan. For retention, you can define cohorts (e.g. first purchase, first launch), calculate D1/D7/D30 and break down the results by channel, platform and pricing plan, and also consider survival analysis (Kaplan–Meier) for time to churn. When you ask “why did sales drop yesterday?”, the model can suggest STL decomposition, Prophet or Isolation Forest and also propose breakdowns (product, country, device) to get to the source of the problem faster. In the end, it is worth making sure you have validation of the results and sanity checks (consistency of totals, counts, duplicates, date distributions), because in practice data quality more often undermines the analysis than the “mathematics” itself.
ML modelling and analysis automation
AI helps with ML modelling and analysis automation because it speeds up model selection, metrics, prototyping and preparation of the deployment pipeline. To start, you can ask for matching the task type and evaluation measures, e.g. churn classification (AUC/PR-AUC), demand forecasting (MAPE/SMAPE), ranking (NDCG) or segmentation (silhouette), along with an explanation of the choice. A good practice is also to force a baseline (e.g. a rule-based or logistic model) before moving on to more complex approaches such as XGBoost. This reduces the risk that a “better model” results solely from incorrect evaluation.
AI shortens the time needed to build prototypes thanks to AutoML, as long as you make sure data splitting and leakage risk are handled properly. Platforms such as Google Vertex AI AutoML, Azure AutoML, H2O.ai or DataRobot let you build models in 1–2 days that would normally take a week, and an assistant can help configure a time-based split and cross-validation. At the same time, it is worth asking about costs and limits, because AutoML can be more expensive than your own training on large datasets. In practice, the key instruction is: “propose a split and validation method so as to exclude leakage, and provide cost constraints”.
AI supports explainability and model operationalisation, because it makes it easier to break the result down into component factors (“what drives the result?”) and prepare monitoring after deployment. For interpretation, you can use SHAP, permutation importance and partial dependence, and also ask for an assessment of the stability of feature importance across folds and for the identification of features acting as proxies for sensitive data (e.g. postcode as a proxy for status). At the deployment stage, the model can help prepare a pipeline outline: training → validation → model registry → deployment → drift monitoring, e.g. based on MLflow, Kubeflow, SageMaker or Vertex AI (or more simply: cron + Docker). The minimum set of metrics after deployment includes prediction quality, latency, the proportion of missing features and data drift signals (e.g. PSI).
AI broadens analysis to causal approaches, forecasting and work on documents when a predictive model alone does not fully answer the business question. If the goal is “did change X cause Y?”, the model can support uplift modelling, causal forests, synthetic control or difference-in-differences and suggest a DAG diagram as well as identification assumptions (e.g. in DoWhy, EconML, CausalML). In time series, AI makes it easier to prepare calendar features and compare approaches (ARIMA/SARIMA, Prophet, ETS, XGBoost, LSTM), as well as rolling-origin validation and an error report for 7/30/90-day horizons. When the data is in documents, RAG is useful (chunking, embeddings, a vector database such as Pinecone/Weaviate/FAISS) and refining retrieval settings, and in report automation the model can generate recurring briefs in the format “3 insights + 3 risks + 3 next steps” with links to dashboards and queries.
- 01Task & metric selectionQuick selection, choice explained
- 02Forcing a baselineSimple models, reliable evaluation
- 03Prototyping with AutoMLRapid build, watch out for leakage
AI speeds up the process from model selection to pipeline deployment, increasing the efficiency and safety of analysis.
Interpreting findings and reporting for business decisions
AI helps translate analytical results into business recommendations that can be implemented and then measured for impact. Ask the model for a direct answer: “what to do tomorrow, what to do in the quarter and what not to do”, and then for recommendations with an estimate of impact and boundary conditions. In practice, it is also worth requiring an assessment of implementation risks, because correlation alone is rarely a sufficient basis for a decision. If you want recommendations to be “decision-ready”, additionally ask for the “cost of delay” and to indicate what must be true for the effect to hold.
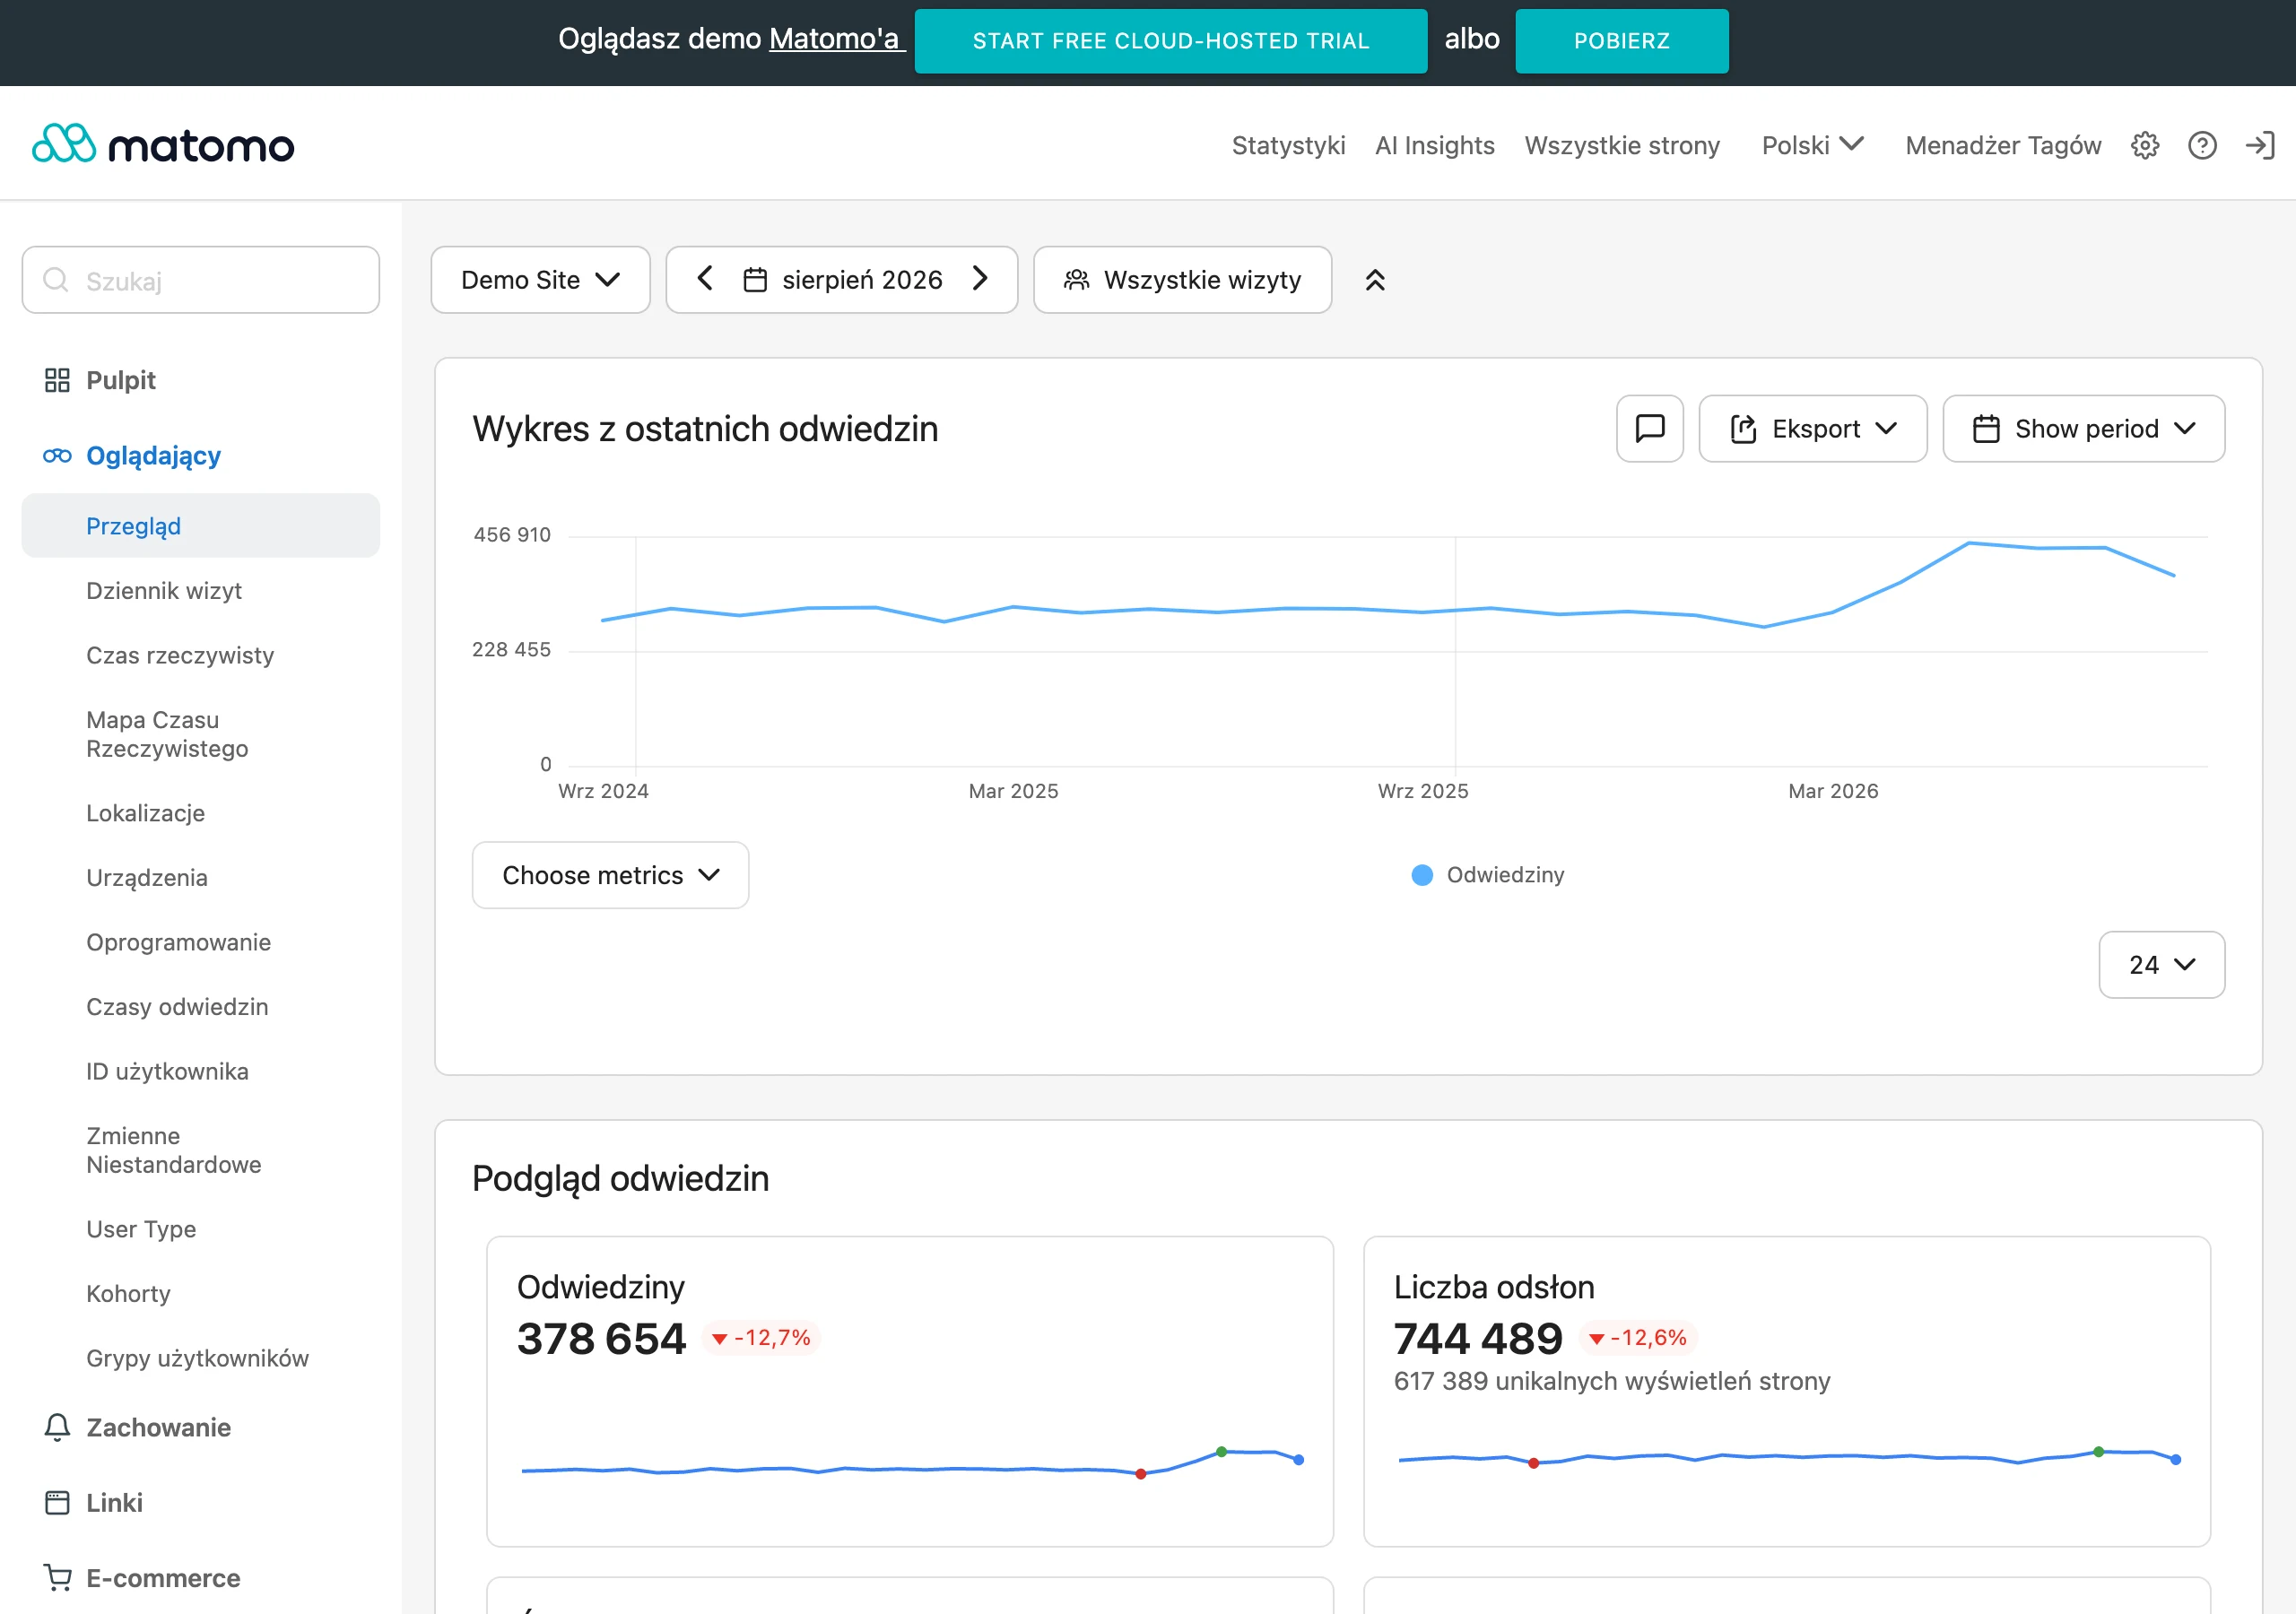
AI streamlines reporting, as long as you impose a clear structure and separate the version for decision-makers from the technical version. You can ask for a report prepared in the following structure: objective, data, method, results, limitations, recommendations, with a length limit (e.g. one page). A good practice is also to request a “for the board” version (3–5 bullet points) and a separate methodological appendix. Always align the narrative with charts and tables to keep the description consistent with the results.
AI can help with designing dashboards, as long as from the outset you focus on users’ questions rather than multiplying charts. Ask for the selection of metrics and filters (e.g. segment, channel, cohort) and for a drill-down proposal instead of adding more tiles. In tools such as Power BI Copilot or Tableau AI, it can generate measures (e.g. DAX) and explanations, but definitions need to be checked in the “metric dictionary”. In practice, a sensible dashboard has 5–9 key tiles, while the remaining elements act as interactive views.
AI makes it easier to communicate uncertainty when you show results as confidence intervals and scenarios rather than reducing them to a single number. You can ask for a direct interpretation (e.g. what 95% CI = [2%, 6%] means) and for a way of presenting differences between segments, e.g. on a forest plot. For “what-if” decisions, AI efficiently prepares Monte Carlo simulations with assumptions about distributions and percentile reporting (P10/P50/P90), instead of relying solely on the mean. This approach reduces the risk of overinterpretation and supports planning better.
AI speeds up experiment prioritisation and A/B planning if you impose a test quality checklist and sample requirements. The model can suggest a test backlog, expected effects and the required sample size for a given power (e.g. 80%) and alpha (0.05). Treat AI as a “second analyst”: ask for criticism of the conclusions and for a list of control questions before you publish the recommendations.
- Randomisation and guardrail metrics
- Duration, stopping criteria and effect heterogeneity analysis
- Peer review plan: alternative explanations and verification tests
Security, ethics and reliability in the use of AI
Safe use of AI in data analysis starts with protecting sensitive data and GDPR compliance. Do not paste PII into public models (e.g. email, phone number, national ID number) or contractual data; use anonymisation, masking or enterprise environments instead. It is worth asking AI for a pseudonymisation plan (e.g. salted hash, tokenisation) and for data minimisation, but implementation decisions should be made in line with organisational requirements. If you use tools such as ChatGPT Enterprise, Azure OpenAI or Vertex AI, check the retention and customer-data training policies before you start working on internal materials.
The reliability of AI answers in research increases when you enforce fact-checking and separate facts from inference. Ask the model to mark the confidence level and indicate what is a conclusion and what is a result “from the data”, as well as how to verify it. In data analysis, it is particularly important to require answers to be based on code or SQL results, not on guesswork. Such rules reduce the risk of hallucinations, especially with figures and attributions.
Legal aspects related to content and data require verification of copyright and licences, also when AI merely paraphrases. The model may unknowingly reproduce protected fragments, so reports should cite sources and follow the rules of fair dealing or the terms of the licence. For datasets and APIs, it is worth asking straight away about usage restrictions: whether the data can be used in a product or only for internal analyses. When in doubt, keep metadata in the report, such as the source version, licence and access date.
Model ethics are particularly important when predictions affect people, and AI can help calculate and interpret fairness metrics. In such situations, ask for metrics such as disparate impact, equalised odds and TPR/FPR differences between groups, as well as an analysis of sensitive features and their proxies (e.g. location). The model can suggest mitigation strategies such as reweighing, constraints or post-processing. Also take into account the trade-off: improving fairness may lower AUC, but it is sometimes legally required or important for reputation.
Security of AI-based systems also includes the risks of prompt injection and information leakage, especially in RAG solutions and chatbots. It is worth specifying safeguards such as filtering user instructions, an allow-list of sources, context isolation and scanning responses for secrets, and on the company side supplementing this with DLP and logging queries for audit. For auditability and reproducibility of results, keep information about the input data, code, prompts and model versions and parameters (e.g. as an “AI audit log”). In parallel, plan drift monitoring (e.g. PSI as a signal), post-deployment quality control and cost optimisation (samples, cache, smaller models, batching), and at the organisational level have clear policies: approved tools, data classification and incident procedures.
FAQ
Frequently asked questions
How does AI help refine the goal and research questions in data analysis?
AI breaks a broad problem down into specific, measurable questions and helps turn intuition into hypotheses and a measurement plan. It can also identify observable variables, metrics and how to calculate them.
Can AI help determine which metrics and KPIs to choose for a hypothesis test?
Yes, it can suggest KPIs, the time horizon and the minimum effect, as well as identify falsifiable hypotheses. The article also recommends asking for a power analysis plan and the required sample size.
How does AI help avoid data aggregation errors and Simpson’s paradox?
The model can warn against analysing at too high a level of aggregation and suggest segmentation when averages mask the issue. The text gives the example that average ARPU may rise while falling in the new-user segment.
Why is it worth using AI to create a metrics dictionary and definitions for the team?
Because it reduces disputes about what a given metric actually means, for example whether an active user is a login or a transaction. AI can prepare a draft metrics dictionary with definitions, formulas and data sources.
How does AI help choose a research method: an A/B test, cohort analysis or a predictive model?
It is enough to clarify whether the problem is causal or predictive, and the model can indicate the right approach. The article also mentions confounding risks and methods such as propensity score, difference-in-differences and instrumental variables.
How do you check the reliability of AI answers in research and data sources?
You need to require a citation, a source excerpt and a publication date, and when dealing with numerical data compare at least two independent sources. If key claims cannot be verified, the result should be treated as inspiration, not fact.