

Fundamentals of data engineering in SEO: how to standardise metrics and data sources?
You will standardise metrics and data sources in SEO when you build a single data model with consistent definitions, identical time windows and clearly described aggregation rules for all reports. In practice, this means that questions such as “why is CTR lower even though the position is rising?” stop being a lottery, because you know that CTR in GSC is calculated per query/URL, while position is an impressions-weighted average. The key step is a metric dictionary (e.g. ‘position_avg’, ‘impressions’, ‘clicks’) and unambiguous aggregation rules (day/week, query-level vs page-level). This way, two people do not get different results just because they summed or filtered the same data differently.
At the start, it is worth organising which types of data you are comparing at all, because a drop in traffic can rarely be explained reliably with a single table. In a data-driven approach, you combine performance signals with technical, content, link and behavioural data (GA4) to answer “what has the biggest impact on the traffic drop?”. This setup makes it easier to diagnose issues such as “why is Google not indexing new pages despite the XML sitemap?”, because you can compare GSC statuses, crawl data and bot logs and identify the bottleneck (e.g. URL discovery failure or a crawl budget limit). Below are the main categories of data that are worth keeping as separate, but combined in analyses, segments.
- performance: clicks, impressions, CTR, positions
- technical: HTTP statuses, canonical, indexability
- content: topics, entities, intents
- links: internal and external
- user behaviour: GA4
Report consistency most often “drifts apart” at URL level, which is why the starting point is URL normalisation and working in parallel on two layers. Without normalisation (parameters, slash, case), it is hard to answer honestly the question “is this one page or 12 variants?”, because identical content lands in the data as separate rows. A practical solution is a ‘url_canonicalized’ layer that removes UTM tags, standardises parameters and maps to canonical, while storing both ‘url_raw’ and ‘url_norm’. Only joins on ‘url_norm’ make it possible to reliably connect data from GSC, crawls and logs, and build reports per directory or page type.
To make standardisation work continuously, not just “for today”, it is worth clearly distinguishing a one-off analysis from a pipeline with cyclical ingestion and quality control. An analysis will answer “what happened?”, but the pipeline also adds “will it happen again and how quickly will we detect it?”, which is crucial when manual GSC exports fail to catch drops for tens of thousands of URLs. In practice, this means automated loads and a layer in which metrics, definitions and aggregations remain fixed and shared across all dashboards. Such a foundation also prepares SEO for the era of AI Overviews/SGE, where alongside clicks the importance of exposure grows (impressions, share in SERP elements) and conversion/lead measurement, rather than sessions alone.
- 01Metric dictionaryDefine names (e.g. 'position_avg').
- 02Standardised time windowsSynchronise dates and intervals.
- 03Clear aggregation rulesSpecify summing (e.g. per query/page).
- 04One data modelBuild a consistent structure for everyone.
- 05Valuable data vs. noiseSeparate the key from the irrelevant.
The key is one data model, consistent definitions and rules, which eliminates guesswork in results analysis.
SEO data sources: how to acquire data effectively at scale?
You will acquire SEO data effectively at scale when you base the process on automated integrations (API, exports, logs) rather than on manual exports and one-off reports. The foundation is the Google Search Console API, because it allows visibility analysis at query-page-country-device level and day-to-day or week-to-week comparison of changes. At the same time, you need to account for limits and for the fact that the API returns a maximum of 5,000 rows per request, so data retrieval is carried out iteratively by filters (e.g. URL directories). If you do not plan iterations and segmented pulls, you will quickly “cut off” the data, and the report will stop showing the full picture of visibility.
The best way to collect behaviour and conversion data is through GA4 export to BigQuery, because then you can directly verify whether changes in clicks from GSC translated into leads or revenue, and which landing pages were affected as a result. You combine events (e.g. purchase/lead) with the ‘landing_page’ dimension and separate organic vs paid, instead of relying solely on averaged traffic. In the same place, you can also build your own attribution based on paths, which helps avoid the pitfalls of last-click in assessing SEO impact. This means that SEO priorities come not only from clicks, but also from business impact.
Server logs are crucial because they provide a clear answer to the questions: “is Googlebot actually crawling these URLs?” and “is crawl budget being wasted on parameters?”. In practice, you analyse User-Agent, (optionally) IP with reverse DNS verification, HTTP status codes and response times, and for work at larger scale you use Elasticsearch/Kibana, BigQuery or S3 + Athena. Crawlers and structure audits (Screaming Frog, Sitebulb, OnCrawl, JetOctopus) complement the picture with data on linking, canonicals, indexability and rendering. If you want to identify orphan pages, you combine crawl results with analytics/GSC data and the sitemap, so you can catch URLs visible in the data but unreachable via links.
- SERP data and result features from external sources (DataForSEO, SerpApi, Semrush API, Ahrefs API), together with features such as PAA, sitelinks, video
- link data (external and internal), where snapshots need to be versioned, and for internal links you build a URL→URL graph and calculate, for example, internal PageRank
- CMS data (authors, publication and update dates, tags, templates, content fields) for analysing drops vs content “freshness” and template errors
- product data and e-commerce feeds (stock levels, prices, variants, availability) to detect indexing of unavailable variants and canonical/noindex rules
- performance and CWV data (CrUX, Lighthouse, WebPageTest, RUM) to analyse correlations between LCP/INP and CTR and conversions per template and device
Data architecture and ETL/ELT pipeline for SEO: key elements and tools
An ETL/ELT pipeline for SEO works best when you have a well-chosen data store, a raw and a cleaned layer, and automated task orchestration. The most common choices are BigQuery (because it integrates easily with GA4), Snowflake or Redshift, while in smaller projects Postgres is usually enough. Excel is only suitable for a few tens of thousands of rows, because with GSC data at query-page level you quickly get into millions of records per month. Such an architectural decision is a prerequisite for SEO reporting to be repeatable and scalable.
A coherent architecture is built by separating the data lake and the data warehouse, that is, storing raw files (logs, crawls, exports) separately from curated tables for reporting. This division makes it easier to reproduce processing and compare versions when results change, for example after a parser fix. Orchestration (Airflow, Dagster or Prefect) automates API retrieval, file loading and transformations, so reports are not dependent on manual actions. A typical cadence is logs every hour, GSC daily (with a 2–3 day delay) and crawls weekly, while the question “is the data complete yet?” is answered by the ‘data_freshness’ metadata.
Transformations and data quality control are easiest to run in dbt, because you describe the logic in SQL, add tests and model documentation (e.g. ‘fact_gsc_daily’, ‘dim_page’, ‘dim_query’), and keep the change history in Git. Source ingestion is streamlined by connectors (Airbyte, Fivetran), and process resilience is improved by sensible error handling: retry, backoff and a dead-letter queue (e.g. Pub/Sub/SQS) for failed batches. To avoid metric drift and “two truths” in dashboards, you need a single semantic layer and the same fact and dimension tables for all reports. You can reduce processing costs through partitioning by date, clustering by ‘site’/‘page_type’ and building aggregates (e.g. daily facts instead of raw GA4 events), so queries do not scan excessively large tables unnecessarily.
- 01Raw data layerLogs, crawls, exports
- 02Data warehouse (curated)Organised, cleaned data
- 03ETL/ELT pipeline and orchestrationAutomated processing and transfer
- 04Reporting and scalabilityRepeatable, scalable SEO insights
“A coherent architecture separating the data lake and warehouse is a prerequisite for repeatable and scalable SEO reporting.”
Data modelling and quality in SEO: how do you ensure data consistency and accuracy?
You will maintain SEO data consistency and accuracy if you base reporting on a stable model (facts + dimensions) and automatic quality tests that catch problems before they reach dashboards. In practice, the most common setup is a performance fact table (e.g. “fact_gsc_daily”) and dimensions for page, query, country, device and page type, which makes comparisons easier without the risk of incorrect aggregations. Such a model answers operational questions directly, for example how quickly to compare category results across countries or devices. If you do not have one consistent data model, the same metrics will start to differ depending on who counts them and how.
Mapping queries to topics, entities and intents organises analysis at the point where working with individual keywords is no longer enough. Instead of storing only phrases, you build entities (e.g. “entity”) and a “query_to_topic” table, which you create using NLP rules (e.g. spaCy, fastText) or embedding models to assess “end-to-end” topic coverage. In parallel, you classify intent (informational, transactional, navigational, local) using rules (e.g. “price”, “buy”, “reviews”) and an ML classifier, and save the result as a dimension for reports. This makes it easier to separate a situation where top-funnel grows from one where sales are actually falling.
You will only see cannibalisation and technical conflicts after joining performance data with crawl data on a single key (for example a normalised URL) and after implementing deduplication rules. In cannibalisation, you calculate the share of clicks per query and identify cases where several URLs share traffic without any one dominating (for example, in the top 3 no URL has >60% of clicks), which usually lowers CTR and result stability. When joining GSC with the crawl, you check whether the URL is indexable, has the correct canonical and status 200, and then flag conflicts such as clicks in GSC alongside noindex in HTML, robots blocks, an incorrect canonical or soft 404. These joins let you move from “what we see in the SERP” to “what is causing it at the technical layer”.
You will maintain the credibility of reports when you validate the data and keep an eye on comparability over time, even if changes are taking place on the site. In practice, you configure data quality tests (for example dbt/Great Expectations) for key uniqueness (url+date), ranges (CTR 0–1) and completeness (no nulls in “page_type”), so that after a template change or an API limit, errors do not slip through “silently”. In a multi-country environment, you separate the country from GSC (country), the page language (hreflang) and the business market, because they do not always mean the same thing. During a migration or slug changes, you maintain 301/rel=canonical mappings and a constant “page_id” independent of the URL, and to assess trends you use consistent 7/28-day windows and YoY comparisons with day-of-week control.
Monitoring, alerts and automation of decisions in SEO: how to manage processes effectively?
You manage SEO processes more efficiently when you automatically monitor key metrics and trigger alerts per segment (category, page type, country), rather than relying solely on global charts. An anomaly detection system (for example Prophet, ADTK, BigQuery ML) can notify you about drops in clicks or impressions when the deviation exceeds, for example, 3σ against the 28-day median, which reduces the risk of “missing” problems in a specific area of the site. At the same time, you track indexation, because GSC coverage reports can be delayed and heavily aggregated, so you compare them with your own crawl and sitemap data. This way, you calculate the difference between “indexable_pages_in_sitemap” and “indexed_pages” and get a list of gaps to prioritise.
You will save the most time if technical alerts and on-site change audits run as close as possible to the moment of deployment, rather than only in the weekly report. When the question “did this deploy break SEO?” comes up, you combine logs with the deployment date and raise an alert in Slack/Teams when 5xx errors exceed, for example, 1% of bot requests for 30 minutes, because such incidents can be short-lived, yet cause a lot of disruption. A complement to this is automatic diffing of crawl snapshots, which shows what changed in title/H1, canonical, meta robots, structured data and linking. If you do not log changes and compare snapshots, diagnosing drops is based on guesswork rather than on a concrete date and a concrete scope of modifications.
Decision automation works best when dashboards and the task backlog use a single source of truth and the same metric definitions. Reporting tools (Looker Studio, Tableau, Power BI, Metabase) only make sense when they are based on the same fact and dimension tables, and when the metrics and model versioning are documented, which settles disputes such as “which dashboard is correct?”. On this basis, the system can generate task lists: pages with high impressions and low CTR, pages with soft 404, or products that are out of stock but still in the index. You prioritise with scoring, where impact comes for example from impressions × potential CTR uplift, and effort from the type of fix.
You will strengthen control over risks in a large site if you continuously monitor internal linking, bot blocks and treat the effects of changes as experiments, not “impressions”. Changes in the menu, footer or pagination can cut off hundreds of URLs, so you calculate the drop in internal PageRank and the increase in click depth to quickly catch deteriorating accessibility. In addition, the pipeline should test key paths daily (HTTP fetch) and report changes in status, headers and noindex/nofollow directives, which protects against accidental blocking in robots.txt or X-Robots-Tag after deployment. When you optimise, for example, title for CTR, you present the result as a quasi-experiment: with a control group, a stabilisation period and statistical significance plus a confidence interval, instead of relying on subjective conclusions.
- 01Data segmentationMonitoring in segments, not globally
- 02Anomaly detectionAlerts when deviation exceeds 3σ
- 03Own monitoringCompare GSC with your own data
- 04Identifying gapsDifferences: Indexable vs. Indexed
- 05Automation of decisionsTurn alerts into priority tasks
The key to saving time is turning data into proactive segment-level alerts and automated audit actions, rather than reactive tracking.
Advanced applications of Data Engineering in SEO: how to use data to predict and optimise?
You will use data to predict and optimise in SEO when you connect visibility from GSC with business outcomes and use models that indicate priorities and expected return, rather than just “traffic”. Forecasting (e.g. Prophet, ARIMA or BigQuery ML) makes it possible to answer whether investment in a given category makes sense and when you will realistically see the effect, because it takes into account weekly and annual seasonality as well as structural changes such as migrations. In this approach, you do not rely on simple extrapolations, but build scenarios based on historical data and stable comparison windows.
You will get the most practical optimisation when you calculate the value of queries and pages by combining clicks from GSC with leads or revenue from GA4/CRM. This lets you build a value_per_impression or value_per_click ranking and know what to optimise first, even if a given phrase has lower volume. Such a model often shows that “less popular” queries deliver a higher business result, which can change the order of actions in the backlog.
Scaling content and topic planning is made easier by clustering, where you combine queries from GSC, SERP features and embeddings to group topics and detect gaps in coverage. The answer to the question “what articles should I write to close the cluster?” then comes from graph analysis: pillar + supporting pages, with priority calculated based on potential (impressions) and difficulty (competition in SERPs). In programmatic SEO, the condition for quality is a solid input data model (product/service catalogue, locations, attributes and quality rules), because without it it is easy to generate thin content instead of pages that are genuinely useful.
Advanced automation gives you an edge when you can turn data into concrete recommendations: internal linking, duplicate detection and schema validation in the pipeline. Internal linking suggestions are worth basing on topical similarity (embeddings) and internal authority (internal PageRank), and the question “where should I link from to a new page?” should be translated into a list of sources: pages with high traffic and similar intent, with implementation limits (e.g. a maximum of 3 new links per URL per week). You detect duplicates and thin content through similarity (e.g. shingle/SimHash or cosine similarity of embeddings), and build structured data (FAQ, Product, Article, Breadcrumb) based on the data model and test it by combining drops in rich results with a growing number of errors in required fields (e.g. price/availability) and a list of URLs to fix.
Technical SEO at scale: how do you manage crawl budget and URL indexing?
Managing crawl budget and URL indexing at scale works best when you measure where bots actually “spend” requests and compare that with business value and the quality of pages eligible for indexing. In practice, you calculate the share of bot requests per URL type and compare it with traffic or conversions to answer “is Google wasting crawl on parameters?”. If you see that a large portion of crawl goes to combinations such as sorting or pagination, and only a small percentage translates into value, you implement blocks or canonicalisation and verify the effect in logs after 2–4 weeks.
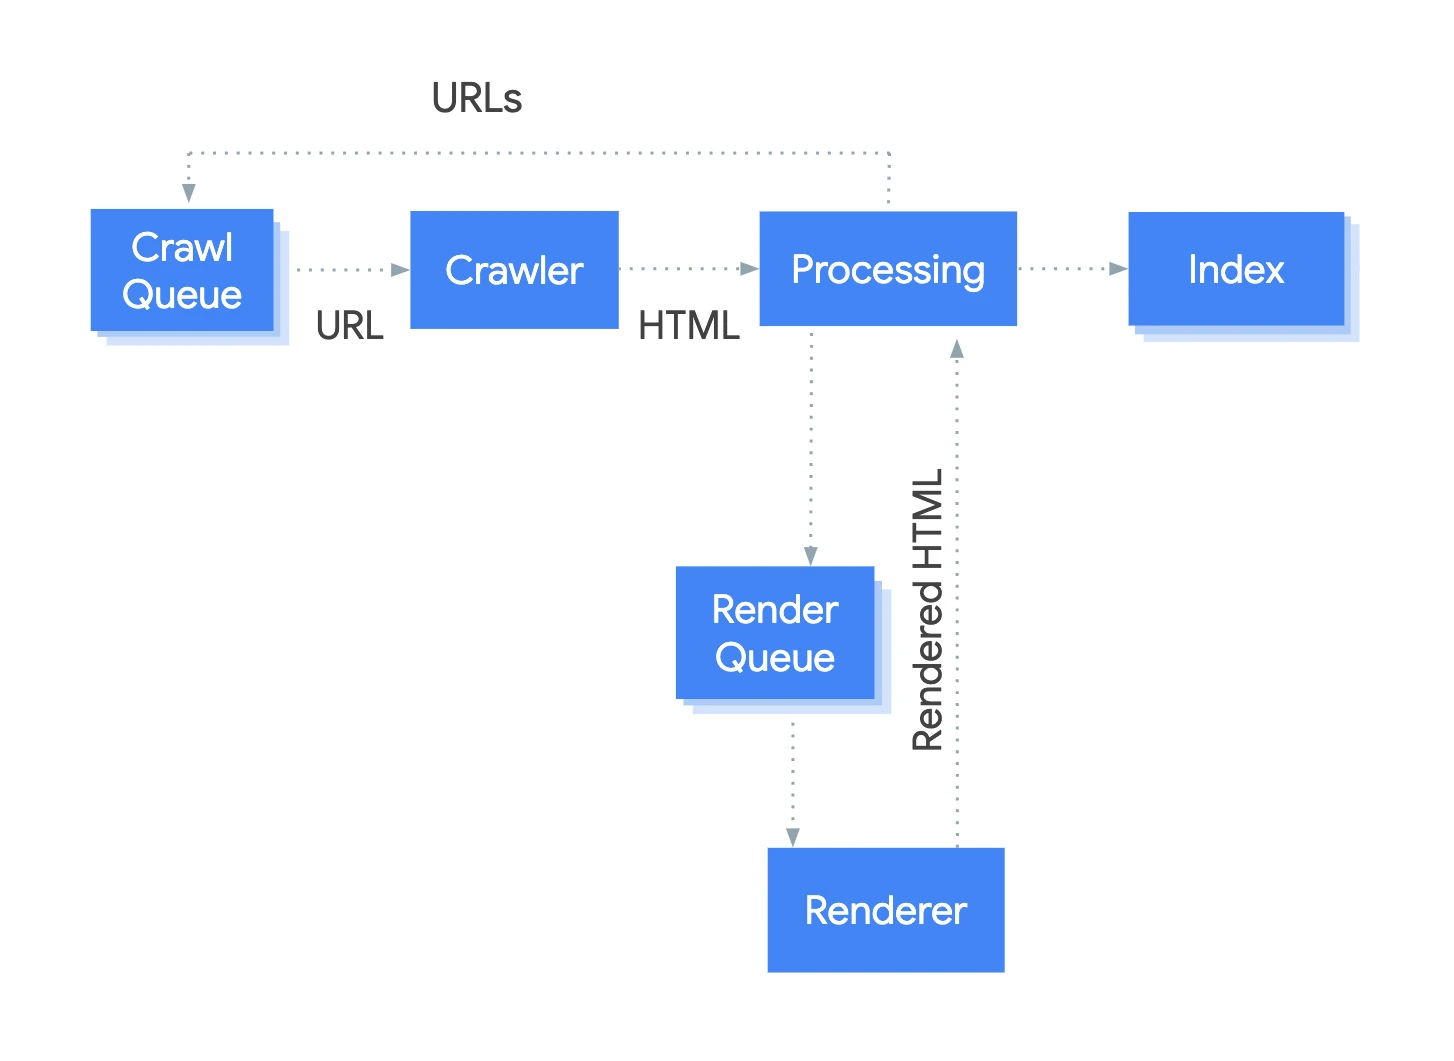
Indexing stops being a “black box” when you combine log, crawl and GSC data to distinguish a URL discovery problem from a quality or accessibility problem. On large sites, discovering new pages is often the bottleneck, so you strengthen signals: sitemap updates, linking from hubs and pinging where supported, then measure the time from publication to the first crawl in logs. At the same time, you identify soft 404s (pages with a 200 code but no real content), which are often behind the increase in “Crawled – currently not indexed”, using heuristics such as content length, the “no results” message, lack of internal links and low time on page in GA4.
Technical risks that genuinely “eat” crawl and derail indexing are identified on the basis of data about rendering, redirects and parameters. For JS pages, you compare HTML without rendering and after rendering (e.g. Puppeteer, Playwright or rendering in the crawler) and record differences such as missing H1, links or schema, to answer “can Google see the content after rendering?”. For migrations and URL clean-up, you build a redirect graph from logs and crawls, detect loops and chains of >2 hops, and then monitor the impact of shortening them on response time and crawl efficiency.
In e-commerce and sites with faceted navigation, the key is to separate parameters into “indexable facets” and “noise” based on real traffic and queries, and then consistently apply canonical/noindex/robots rules. This way you do not cut off valuable combinations (e.g. important filters), while at the same time preventing an explosion of millions of URLs that should not end up in the index. At the information architecture level, you approach the structure in a measurable way: you check click depth, link distribution and internal authority flow, and base the decision “will a new structure help SEO?” on comparing the link graph before and after the changes.
Governance, security and work organisation in SEO: how do you ensure GDPR compliance and team efficiency?
GDPR compliance and the efficiency of the SEO team are achieved when you combine data minimisation, access control, measurable quality SLAs and pipeline reproducibility in one clearly documented operating model. With GA4 integrations into CRM, it is easy to get into personal data territory, so the priorities are minimisation and pseudonymisation: you store only technical identifiers (e.g. hashed user_id), shorten retention and document the legal basis for processing as well as the analytical purposes. In practice, “secure SEO data” means that the team reports on aggregates and dimensions rather than working on raw user data. This approach reduces legal risk while still allowing you to answer questions about lead quality or the effectiveness of landing pages.
It is easier to maintain security controls and order in the workflow when you implement a roles and permissions model that clearly separates raw data from layers prepared for SEO reporting. A typical split is: raw (data engineer), curated (analysts) and marts (SEO), supplemented by row-level security policies for countries or brands, so that access matches the scope of responsibility. To avoid multiplying disputes and blocking work, you clearly define who has access to GA4 events and CRM data, and who only has access to the metrics and dimensions needed for SEO decisions. This way, the question “why don’t I have access to the tables?” is answered by the permissions policy, not by ad-hoc exceptions.
Operational efficiency improves when you treat data quality and freshness as an SLA rather than a “good practice”. You set concrete commitments, e.g. GSC loaded daily by 10:00, logs with a maximum 2h delay and a crawl once a week, which determines whether the data are sufficiently complete for reporting at a given point in time. This structures the weekly workflow, because instead of guesswork you have a clear answer to “can I already report on Monday morning?”. SLA + data freshness monitoring minimise the risk that SEO decisions are based on incomplete or delayed sources.
Scaling the team and reducing the number of errors is easier with consistent documentation and a data catalogue, which organise metric definitions, indicate sources and describe update frequency. In practice, people use Data Catalog (GCP), Amundsen or the built-in dbt documentation, so new joiners do not have to waste time asking questions like “what does this column mean and where does it come from?”. At the same time, it is worth making sure reproducibility is in place: you keep the pipeline and transformations in Git, with reviews and version tags, so that it is possible to recreate a specific state (commit + data snapshot + run parameters) when the results differ from those from a month ago. Governance set up like this shortens diagnostics and reduces the risk of “hidden” changes in report logic.
You can achieve safe deployments and lower the risk of incidents if you test SEO changes in CI/CD and plan platform costs based on data volume and usage patterns. For templates and on-site changes, you automate testing on staging (e.g. Playwright + assertions) for critical elements: headings, meta robots, canonical and schema, and you block the merge on errors, which closes the question of “did someone accidentally add noindex?”. You forecast costs by taking volume and queries into account. For example, 50 GB/day of logs in BigQuery without optimisation quickly starts generating high bills, so you plan for an archive in GCS, daily aggregates and limiting ad-hoc queries through datasets and permissions. The collaboration structure is the final piece. The triangle that works best is SEO strategist (questions and priorities), analyst (metrics, experiments) and data engineer (pipeline, quality), supported by an incident playbook in case of deindexing or a sudden drop in clicks.
FAQ
Frequently asked questions
How do you standardise metrics and data sources in SEO so the reports match?
You need to build one data model with consistent definitions, the same time window and clear aggregation rules. A metric dictionary also helps, as does a consistent distinction between query and page level.
Why do reports from GSC and GA4 often not match?
Most often this is due to mismatched sources, different time windows and different metric definitions. That is why these data should be compared in one model, rather than as separate tool exports.
How can you collect SEO data efficiently at scale?
It is best to rely on automated integrations such as APIs, exports and logs rather than manual reports. With GSC, you need to remember the 5 000-row limit per query and pull data iteratively by filters.
Which data sources are worth combining in SEO analysis?
It is worth combining performance, technical, content, link and behavioural data. The article also points to server logs, crawlers, CMS data, e-commerce feeds, CWV and data on SERP and result features.
How do you normalise URLs in SEO reports?
You need to work on two layers: raw and normalised, for example by removing parameters, UTM tags and tidying up address variants. Only joins based on url_norm allow you to combine GSC, crawl and logs reliably.
How do you monitor SEO issues automatically instead of waiting for a weekly report?
It is worth setting alerts per segment, for example by directory, page type or country, and anomaly detection for clicks and impressions. The article also gives examples of thresholds, such as a rise in 5xx errors above 1% of bot requests for 30 minutes.