

A good reporting rhythm is simple. Some data should be used for quick reactions, while other data is for calm assessment of trends, because these two worlds follow different dynamics. In practice, it does not pay to put everything into one report, because then an outage gets mixed up with normal variability. A weekly report is meant to catch deviations, while a monthly one helps decide what to improve and where to invest time or budget. The most important thing is that the report ends with a decision, not just a set of numbers. This split works especially well when you combine data from analytics, ads, SEO, CRM and the technical layer. But be careful: without data quality control, even the best dashboard will lead straight to wrong conclusions.
What is the practical split of reports into weekly and monthly?
This is not an academic definition. The practical split of reports into weekly and monthly is a way of working in which the week is used to detect problems and deviations, and the month to assess trends and the quality of actions. A weekly report answers the question: has something just broken or clearly worsened? A monthly report answers the question: what really works, what does not work and what should be the priority in the next period.
In a weekly report, you check “alarm” metrics. These are the ones that require action before they have time to drag the result down: sessions, users, conversions, number of leads or transactions, campaign cost, spending pace, CPA or ROAS. On top of that comes the technical layer, that is form errors, tag status, uptime and traffic on the most important landing pages. If a metric can damage the result within a few days, it should go into the weekly review.
A monthly report takes a breath. It covers data that need a bigger sample and broader context, otherwise it is easy to confuse noise with signal. Here you analyse channel trends, the share of organic and paid traffic, the performance of landing pages, SEO visibility, CTR and positions from Google Search Console, lead quality in CRM, conversion paths, funnel drop-offs and Core Web Vitals. Such a report only makes sense when the numbers show not only the result, but also the cause and the impact on the business.
The problem is that this split works only when the data are consistent across tools. In practice, you need to connect GA4, Google Search Console, ad systems, CRM, Google Tag Manager, forms and technical monitoring, and then make sure they speak the same language. If conversions do not match across systems, fix the data first and only then interpret the results.
The logic is dead simple. Weekly, you monitor things that are sensitive to outages and sudden changes, while monthly you assess what requires a fuller picture. This is crucial with a low conversion volume, because data from a single week are often simply too weak for strong business conclusions. In such cases, the weekly report should mainly serve as an early-warning system.
A well-made report does not end with describing the situation. It should lead to a decision: fix tracking, increase budget, switch off a campaign, improve a landing page, solve a technical issue or shift the SEO priority. The report itself does not improve the result; only the reaction to what the report shows does that.
How does the reporting process work in practice?
Reporting works when it is clear from the outset what we measure, where we get the data from, who interprets them and who is supposed to act when a problem is detected. Without that, even a nice dashboard is just a warehouse of numbers. At the start, you define KPIs, the conversion map, the list of key pages, channel owners, alert thresholds and the review frequency.
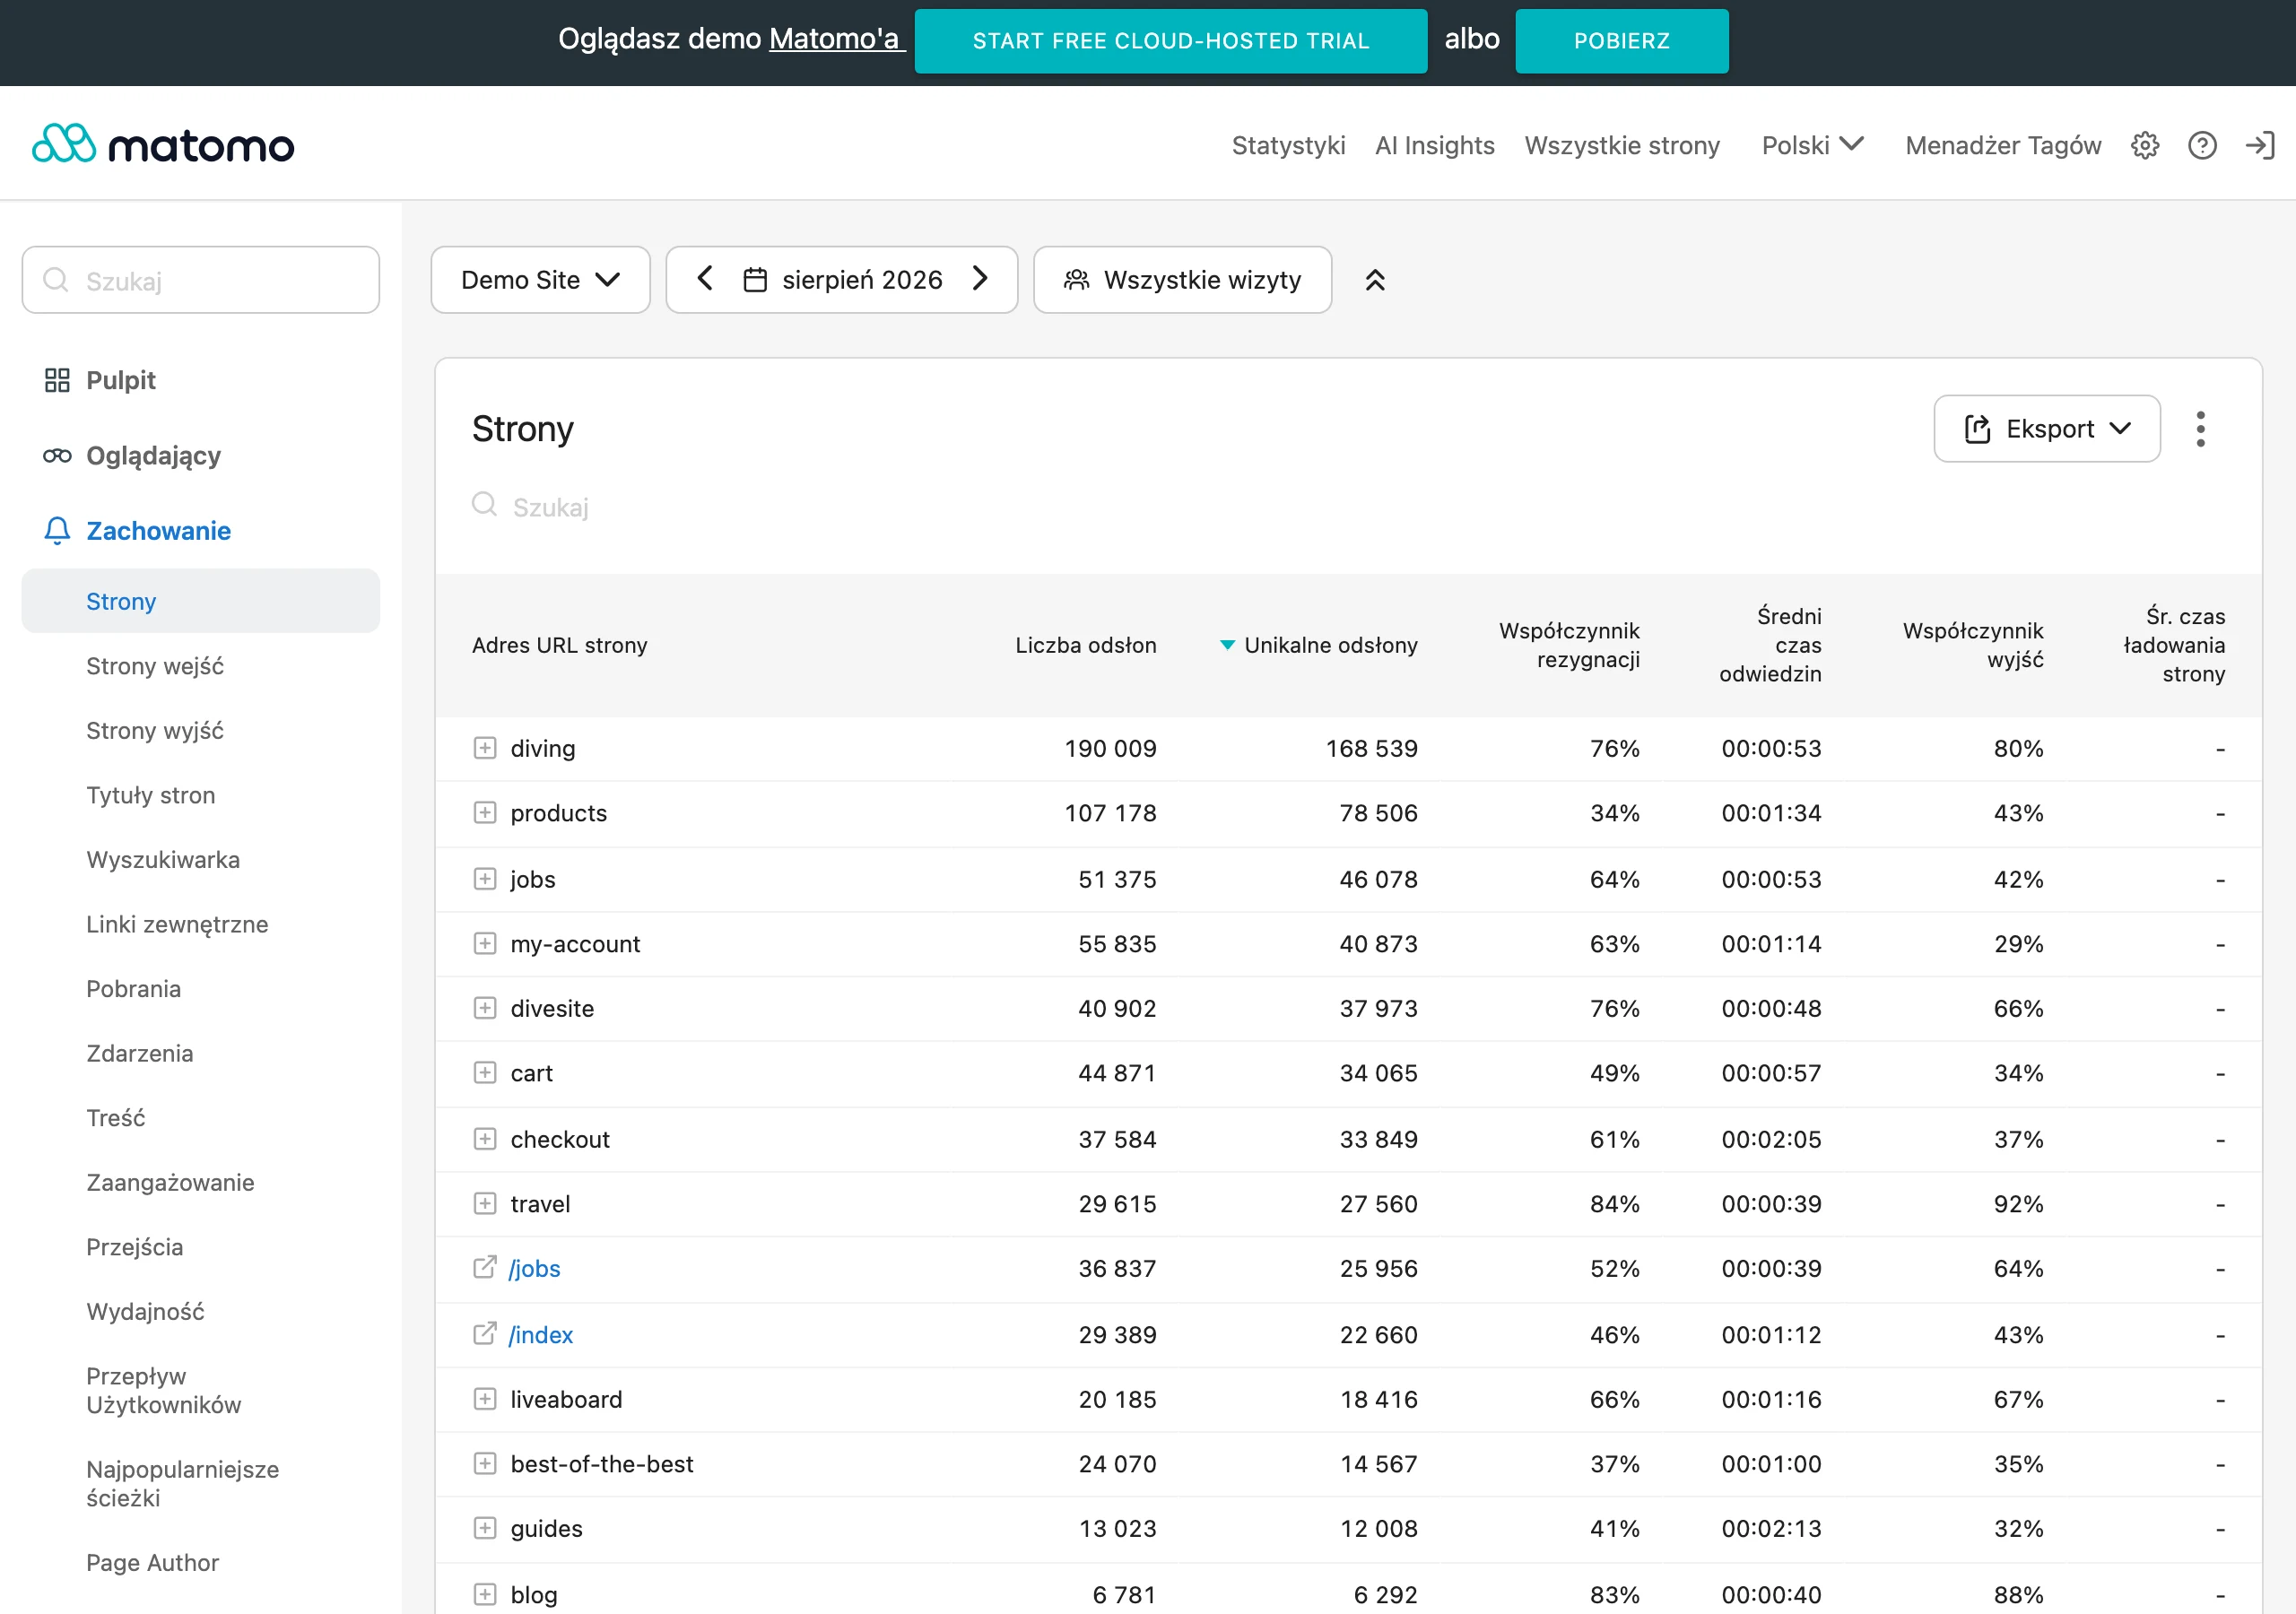
Then comes the data integration stage and a simple question: does the system actually speak one language? In practice, this means connecting GA4, Search Console, Google Ads, Meta Ads, CRM, GTM and technical sources, and then checking conversion names, UTM parameters, currencies, time zones and filters. This is also the moment to validate data quality, because problems with consent mode, script blocking or event errors can completely distort the picture.
Weekly operational control is quick. It consists of comparing results week on week and against the average from recent weeks, to catch deviations before they grow into a crisis. In such a review, you check traffic, conversions, cost, revenue, number of leads, form outages, tag status, 404 and 500 errors, indexing of key URLs and sudden drops in visibility. The point is not a full strategy analysis, but efficient detection of anomalies.
When a deviation appears, a short root-cause investigation begins. First, you check deployments, budget changes, campaign status, loss of SEO positions, payment errors, form issues and the transfer of conversions to advertising platforms. A sudden drop in results more often indicates an operational or technical problem than a shift in the market trend.
Monthly analysis serves a different purpose. It is not about hunting down isolated errors, but about determining which actions genuinely improve results and where the biggest reserves lie. That is why you set out a fuller data period and assess the effectiveness of channels, user segments, new vs returning users, conversion paths, landing pages, content, SEO queries and lead quality in CRM. It is also crucial what was implemented in the previous month, because otherwise it is hard to distinguish the impact of changes from normal seasonality.
The monthly report should turn into a backlog of actions, not a summary that sits in a drawer. Typical decisions include improving content on pages with high impressions and low CTR, updating meta data, redesigning the form, improving mobile performance, correcting attribution or changing the campaign structure. This report is most valuable when it aligns marketing, SEO, UX, development and sales into one shared action plan.
In practice, it is also worth separating the format in which both reports are delivered. Weekly, a short dashboard or an alert with commentary on deviations is enough, while monthly you need a broader summary of trends, causes and recommendations. And here a simple thing makes a difference: keeping notes on deploys, content publication and budget changes. Without that, later diagnosis turns into guesswork.
What to check weekly, what to check monthly, and what does it depend on?
Each week, you look at metrics that can “break” from one day to the next or immediately hit performance, and each month at those that need a larger data sample and broader context. The weekly review is meant to catch deviations. The monthly one is meant to answer whether the direction of travel makes sense. If a given metric requires an immediate reaction, it should go into the weekly report. If a real trend only becomes visible after several weeks, do not force it into a weekly report — assess it monthly.
- Weekly: tracking accuracy for conversions, number of leads or transactions, traffic to key pages, campaign spend pace, ad status, ad disapprovals, form errors, uptime, sudden drops in organic traffic on important URLs, issues with indexing new pages.
- Monthly: channel trends, share of organic and paid traffic, performance of landing page groups, lead quality in CRM, conversion paths, funnel drop-offs, content effectiveness, Core Web Vitals, indexing pace, keyword cannibalisation in SEO, impact of implementations on business goals.
The scope of the report depends primarily on the scale of the business. With high traffic and large budgets, you can break the data down into more segments on a weekly basis, because significant changes emerge faster. With a low number of conversions per week, it is better to stick to system stability, data quality and warning signals. In that case, do not go after “big” business conclusions, because that is usually a statistical mirage.
For lead-generation activities, the monthly report should connect marketing with CRM. The raw number of leads alone does not decide anything yet — it may be growing while the value for sales stands still. If you do not check lead quality on the sales side, you may end up optimising a channel that only appears to be performing well.
If the site lives in a rhythm of frequent developer changes, some things need to be checked more often than “by the book”. After deployments, it is worth reviewing forms, events, canonicals, redirects, robots and the basics of responsiveness on a weekly basis. The more technical changes there are on the site, the more the weekly report should resemble a post-deploy checklist. Because this is not about fireworks in the data, but about whether the foundations are standing.
The frequency of review is also influenced by the channel itself. Paid campaigns usually require quick checks of cost, ad status and conversion passing, while SEO often makes more sense to assess monthly, because positions and clicks can fluctuate in the short term without much consequence. The question is: where is the “right here, right now” risk, and where does perspective matter. That is why SEO is worth monitoring weekly for alerts, but assessing monthly for trend and priorities.
What operational decisions result from weekly reports?
Weekly reports lead to quick corrective decisions. Specific fixes need to be implemented immediately, before the problem starts to cut into performance or — worse — distort the data. Such a report is not for big strategic analysis. It is meant to answer one question: what should be improved today, what should be stopped and what should be accelerated.
It usually starts with data quality. When the number of conversions drops, first you check whether it is really a business problem or tracking: tags, consent mode, forms, conversion imports into ad platforms or errors in GA4. And there is no room for guessing here. Before you change the budget or the offer, make sure you are measuring performance correctly.
The second type of decision concerns paid campaigns. CPA is rising, ROAS is falling, ads are being disapproved, and the budget is disappearing faster than it should — then you usually need to narrow delivery, turn off weak ad groups, refine the message, change bids or shift funds to a more effective segment. In practice, the weekly report acts like a fuse. It is there to protect the budget from loss caused by an error, delay or uncontrolled change.
Another group of decisions concerns landing pages and forms. Traffic is stable, and leads suddenly drop — and then what, do you keep “optimising” the campaign. First check the form, loading time, mobile errors and changes in the content or page layout. Often a small technical fix does more than another round of ad-setting juggling.
In SEO, the weekly report mainly leads to intervention decisions. If clicks on key URLs suddenly drop, indexing errors appear, 404s or issues after a deployment show up, you need to identify the cause and fix the specific element of the site — right here, right now. This is not the moment to rebuild the entire content strategy. It is the moment to remove the obstacle that is blocking performance.
A good weekly report should end with a short action list: what we are doing, who owns it, by when. Without that, it is easy to spot a problem, but just as easy to “talk it through” and leave it for later. In practice, it usually comes down to one of a few decisions: fix tracking, correct the budget, switch off a campaign, improve the landing page, remove a technical error or mark the topic for deeper monthly analysis.
What qualitative analyses should be carried out monthly?
Every month you analyse what cannot be seen in the weekly fluctuations alone. Traffic quality, lead quality, page effectiveness, user behaviour, the impact of deployments on business results — this is the level. Such a review should answer not only what has gone up or down, but above all: why it happened. And that is where the work begins, not the description. A monthly report should lead to decisions on priorities, not just to describing the numbers.
First, assess channel performance in a broader context. Check how the share of organic vs paid, brand vs non-brand and new vs returning users is changing. Only at this level can you see whether traffic growth is really improving results, or merely shifting shares between channels. The data is clear: without context, it is easy to mistake growth for reshuffling.
The next area is landing pages and the conversion funnel. Compare whole groups of landing pages, not just individual URLs, because that way you can spot a problem in the template, offer or form more quickly. See where users drop off: on entry, during scrolling, at the CTA, or only when they submit the form or make payment. If a page has traffic but does not close conversions, the monthly analysis should show the exact stage at which that traffic leaks away.
In SEO, monthly analysis should cover queries from Google Search Console, CTR, rankings, visibility of key URLs, indexing pace and issues such as cannibalization and weak internal linking. Drops and rises on their own are not yet a diagnosis. What matters is which pages have the greatest business potential after improvement, not which ones happen to “look nice” in the table. Pages with a high number of impressions and a low CTR are often the quickest starting point, and that without creating new content.
If the goal is leads, every month marketing needs to be tied in with the CRM. The number of forms alone is not enough, because two channels can deliver a similar volume while producing a completely different quality of enquiries, sales value and closing speed. A monthly report without lead statuses in the CRM shows marketing activity, but it does not show the quality of the result.
Finally, assess the impact of technical and content changes. Compare the deployments from the last month with data on Core Web Vitals, JavaScript errors, forms, indexing and the results of key pages. Such a review should end with a backlog of changes. What to improve straight away, what to test and what to put off because there is simply no real impact.
What are the most common mistakes in reporting and how do you avoid them?
The most common mistakes in reporting are drawing conclusions from the wrong time horizon, a lack of data quality control and mixing metrics that are used for different decisions. As a result, the report looks correct, but it does not lead to sensible action. The most dangerous thing is that the team reacts to numbers that are just noise and ignores those that really signal a problem.
The first type of mistake is judging everything week on week. In SEO, UX and CRO many changes need a larger sample, so weekly fluctuations are often random or caused by seasonality, the layout of weekdays or changes in campaigns. The question is what can be honestly inferred from that with a small volume. If conversion volume is low, on a weekly basis assess mainly system stability and anomalies, not the strategic trend.
The second problem is reporting on data that nobody has verified beforehand. Consent mode, script blocking, changes in GTM, GA4 event errors, source attribution issues and form failures can distort the picture faster than real changes in marketing. That is why after every deployment you should run a simple test instead of trusting dashboards. Does the form work, is the conversion recorded correctly, does the traffic source pass into analytics and the CRM.
The third mistake. A lack of segmentation. When you look only at total traffic or the total number of leads, it is easy to miss that one key channel, one device type or one specific group of landing pages has dropped. In practice, the report should split at least: channels, devices, key pages, brand/non-brand and new vs returning users.
The fourth mistake is lumping operational and strategic metrics together. The weekly report should say what needs a response today, and the monthly one should explain what to change in the action plan over the coming weeks. When you mix an alert about a form outage with a monthly assessment of lead quality in one view, priorities immediately go off the rails.
The fifth problem. A lack of annotations about changes and a lack of an owner for the response. Without information about deployments, budget changes, content publications, campaign modifications and changes on the website, the monthly report loses its diagnostic value. A dashboard alone is not enough. Someone needs to know what to check, who makes the decision and by when the fix is to be implemented.
What minimum requirements must the reporting process meet?
A minimal, sensible reporting process requires: defined conversions, access to basic data sources, one place to review them and a person responsible for the response. Without that, the report becomes just a set of numbers from which nothing follows. The smallest sensible minimum is not a “nice dashboard”, but the ability to detect a problem and make a concrete decision.
The first condition is a simple definition of what the company considers a result. You need to establish what a conversion is, which forms and phone calls matter, which pages are commercially key and which channels are genuinely to be assessed. Because if that is missing, you end up comparing metrics that settle nothing.
The second condition. Working and as consistent data as possible. In practice, that means at least access to GA4, Google Search Console and advertising systems, and in a lead-based business also to the CRM or another source of information about lead quality. The number of leads alone is not enough if you cannot check which sources generate valuable enquiries and which ones only inflate volume.
The third condition is basic tracking quality control. You need to regularly verify whether forms send events, whether conversions reach GA4 and advertising platforms, whether there are issues with tags, consent mode, UTMs, the time zone or event duplication. Even a simple report loses its value when the data is partly incorrect or not comparable across tools.
The fourth condition is simple: one place for the numbers. And that is where key metrics and deviations should be visible, without clicking through ten files and tabs. It does not have to be a sophisticated BI system. To start with, a simple dashboard is enough, combining traffic, conversions, costs, basic SEO data and lead information. More important than making the report more elaborate is being able to see the change in a few seconds and establish where it came from.
The fifth condition is a process owner and an agreed course of action. Someone has to check the report regularly, add context to changes and trigger a response when there is a problem with traffic, a campaign, a form or the site’s visibility. If no one is responsible for interpretation and decisions, reporting turns into a routine with no impact on results. And then all the effort goes to waste.
The sixth condition is a list of typical actions that can be implemented immediately after an deviation is detected. For example: fixing tracking, pausing a campaign, adjusting the budget, checking a form, analysing a drop in the visibility of a specific URL, improving a landing page or verifying changes after a deploy. These are not “ideas for some time in the future”, but ready-made switches to use. This means the report does not end with the statement that “something has dropped”, but leads to the next step.
In more complex projects, it is also a good idea to add notes about deployments, content publications and budget changes from the outset. This is not a luxury extra, but a diagnostic element that makes it much easier to interpret the monthly report (especially when a lot is happening at once). The more channels and changes there are on the site, the more a report without context loses value.
FAQ
Frequently asked questions
Which reports should you check weekly and which monthly in marketing and SEO?
Every week, it is worth monitoring metrics sensitive to outages and sudden changes, while monthly you should check those that need a larger sample of data and broader context. Weekly is for alarms, monthly — for trends and action priorities.
Should traffic, conversions and campaign costs be included in the weekly report?
Yes, if they can deteriorate quickly and immediately affect results. The weekly review should also include, among other things, the number of leads, campaign cost, spend pace, CPA and ROAS.
Why is SEO visibility and CTR better analysed monthly rather than only weekly?
Because these data often need a larger sample and broader context to distinguish noise from a real trend. Monthly analysis shows priorities better, while weekly analysis is mainly for catching alerts.
When should a weekly report turn into a post-deploy checklist?
When the site often goes through technical changes. Then you need to check forms, events, canonicals, redirects, robots and responsiveness more often.
What decisions should result from a weekly report?
Most often, this involves fixing tracking, adjusting the budget, pausing campaigns, improving the landing page or removing a technical error. A weekly report should lead to a quick response, not a long analysis.
Is the number of leads enough to assess activities monthly?
No, because the number of leads alone does not yet say anything about the quality of the result. A monthly report should combine marketing with CRM and check whether the leads have real sales value.