
Does your website load quickly enough? Largest Contentful Paint (LCP), a key Core Web Vitals metric, measures the time it takes for the largest visible element on the page to appear and has a huge impact on SEO and user experience. Find out why achieving a score below 2.5 seconds is critical and learn effective LCP optimisation methods that can not only improve your ranking in Google, but also increase visitor engagement.
What is Largest Contentful Paint (LCP)?
Largest Contentful Paint (LCP) is a key performance metric that determines how quickly the largest visible element appears on a page. This could be an image, a video, a substantial block of text or other content visible without having to scroll. LCP is hugely important for user experience, because it shows how quickly users will see the main content of the page.
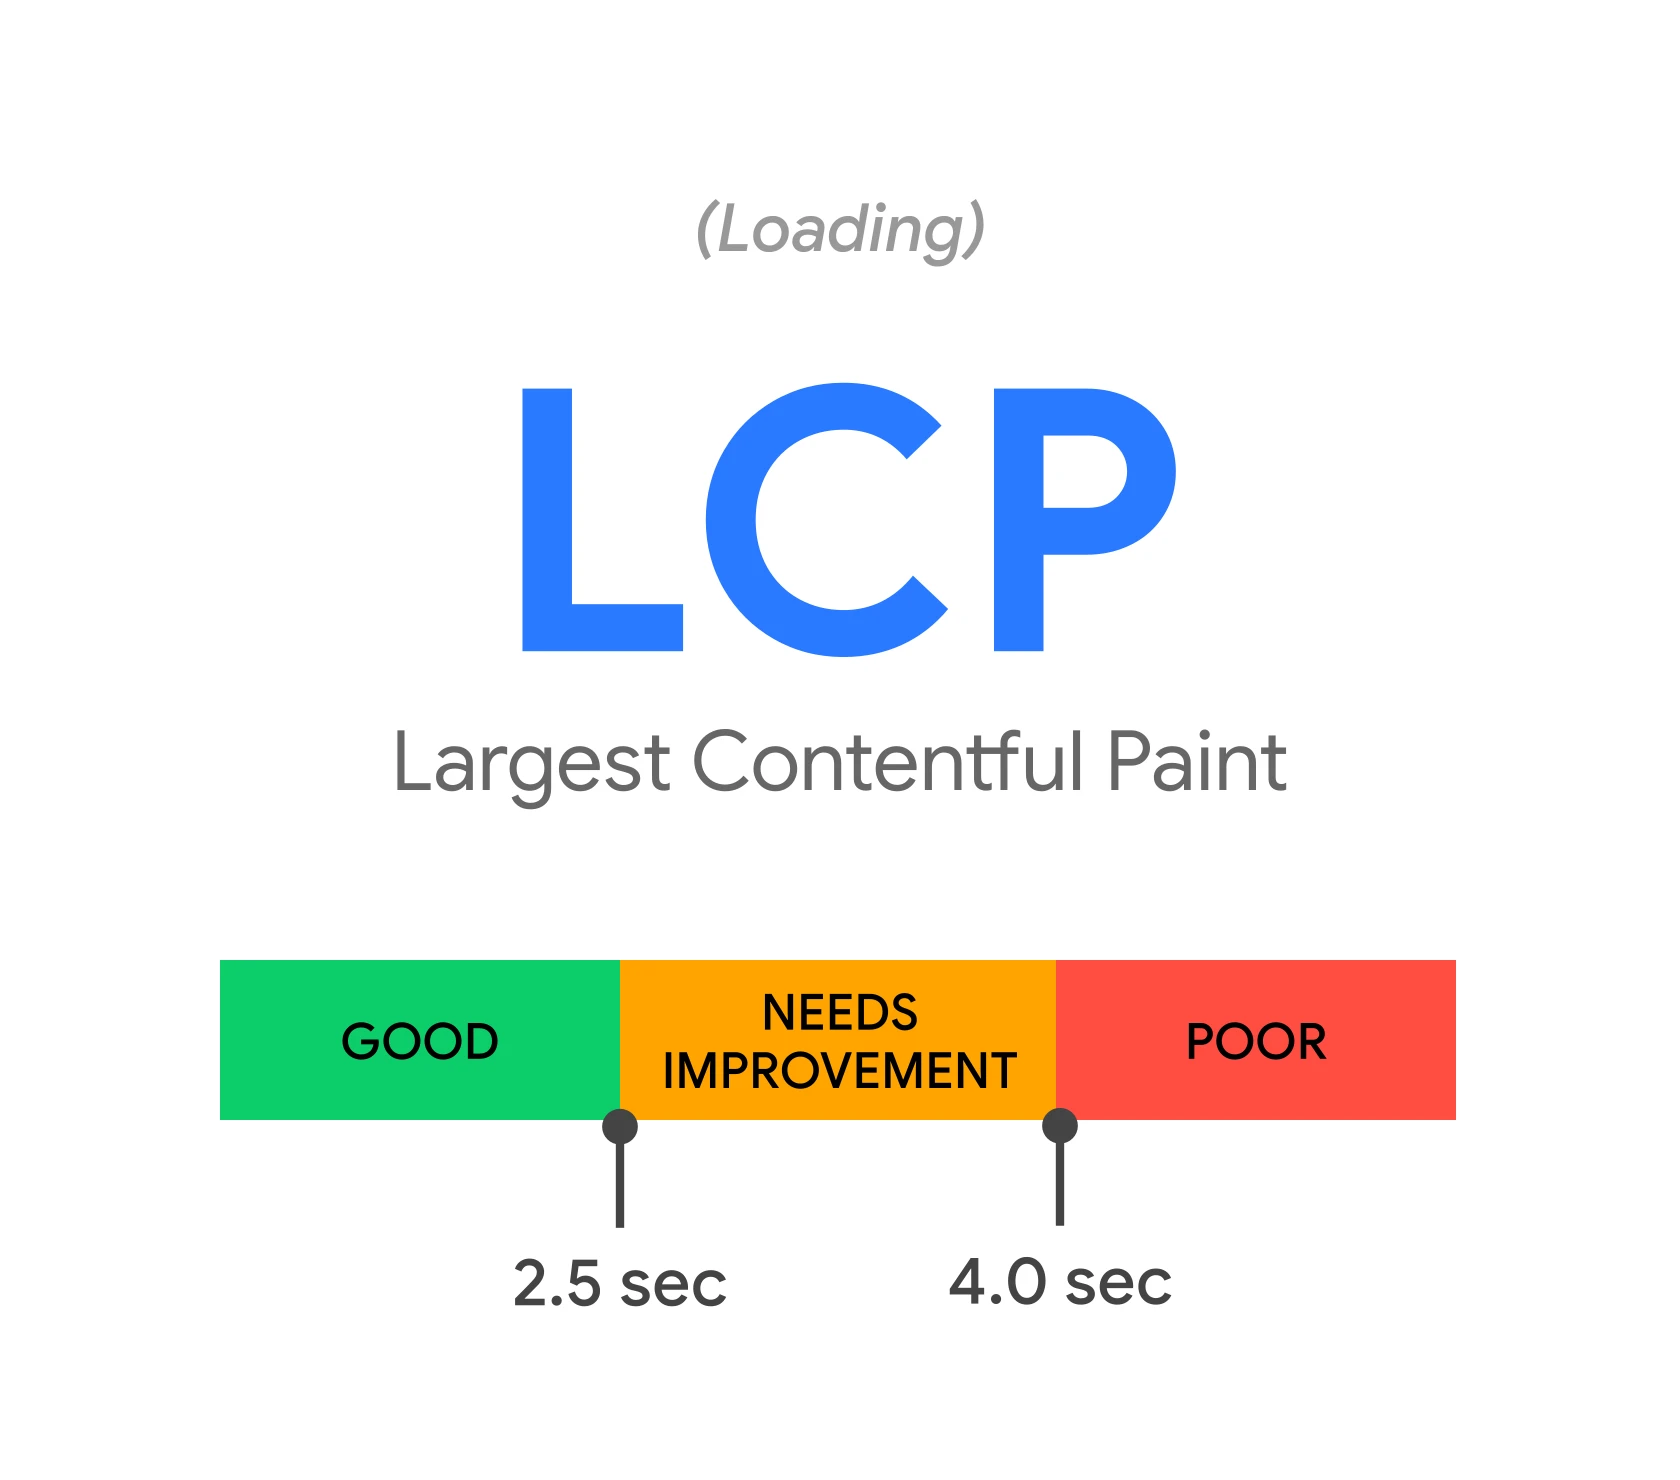
This metric is part of Core Web Vitals, alongside First Input Delay (FID) and Cumulative Layout Shift (CLS). Since May 2021, Google has taken LCP into account as one of the factors influencing a page’s position in search results. Good results not only improve SEO, but also increase visitor satisfaction, as users expect instant access to content.
To provide users with an optimal experience, LCP should be less than 2.5 seconds. Results exceeding 4 seconds are considered unsatisfactory and can lead to drops in rankings and an increase in bounce rate. That is why analysing and optimising LCP is a priority for every website owner and SEO specialist.
Definition and significance of LCP
Largest Contentful Paint (LCP) is an important performance metric that measures the time needed to render the largest visible element on a page. This could be an image, a heading, a block of text or other content visible above the fold (above the fold). LCP is one of the key Core Web Vitals metrics, alongside First Input Delay (FID) and Cumulative Layout Shift (CLS), which together affect the overall assessment of user experience.
The significance of this metric lies in the fact that it shows how quickly a visitor can see the main content of the page. The shorter the LCP time, the better the user experience. Research indicates that pages with a result below 2.5 seconds are characterised by a lower bounce rate and a higher conversion rate. By contrast, values exceeding 4 seconds are considered unsatisfactory and can negatively affect a page’s position in search results.
LCP has a direct impact on SEO. Since 2021, Google has taken this metric into account as a ranking factor. That is why LCP optimisation is crucial not only for improving visibility in search engines, but also for increasing user satisfaction. Good results translate into a better visitor experience and higher website effectiveness.
The role of LCP in Core Web Vitals
LCP (Largest Contentful Paint) is one of the key elements of Core Web Vitals, alongside Cumulative Layout Shift (CLS) and First Input Delay (FID). It measures the time needed to render the largest visible element on a page, which translates into how quickly the user notices the main content. It is LCP that has a direct impact on the visitor experience.
Since 2021, Google has recognised LCP as an important ranking factor. Optimising this metric not only improves a page’s position in search results, but also increases user satisfaction. Pages that achieve an LCP time below 2.5 seconds record fewer bounces and higher levels of engagement.
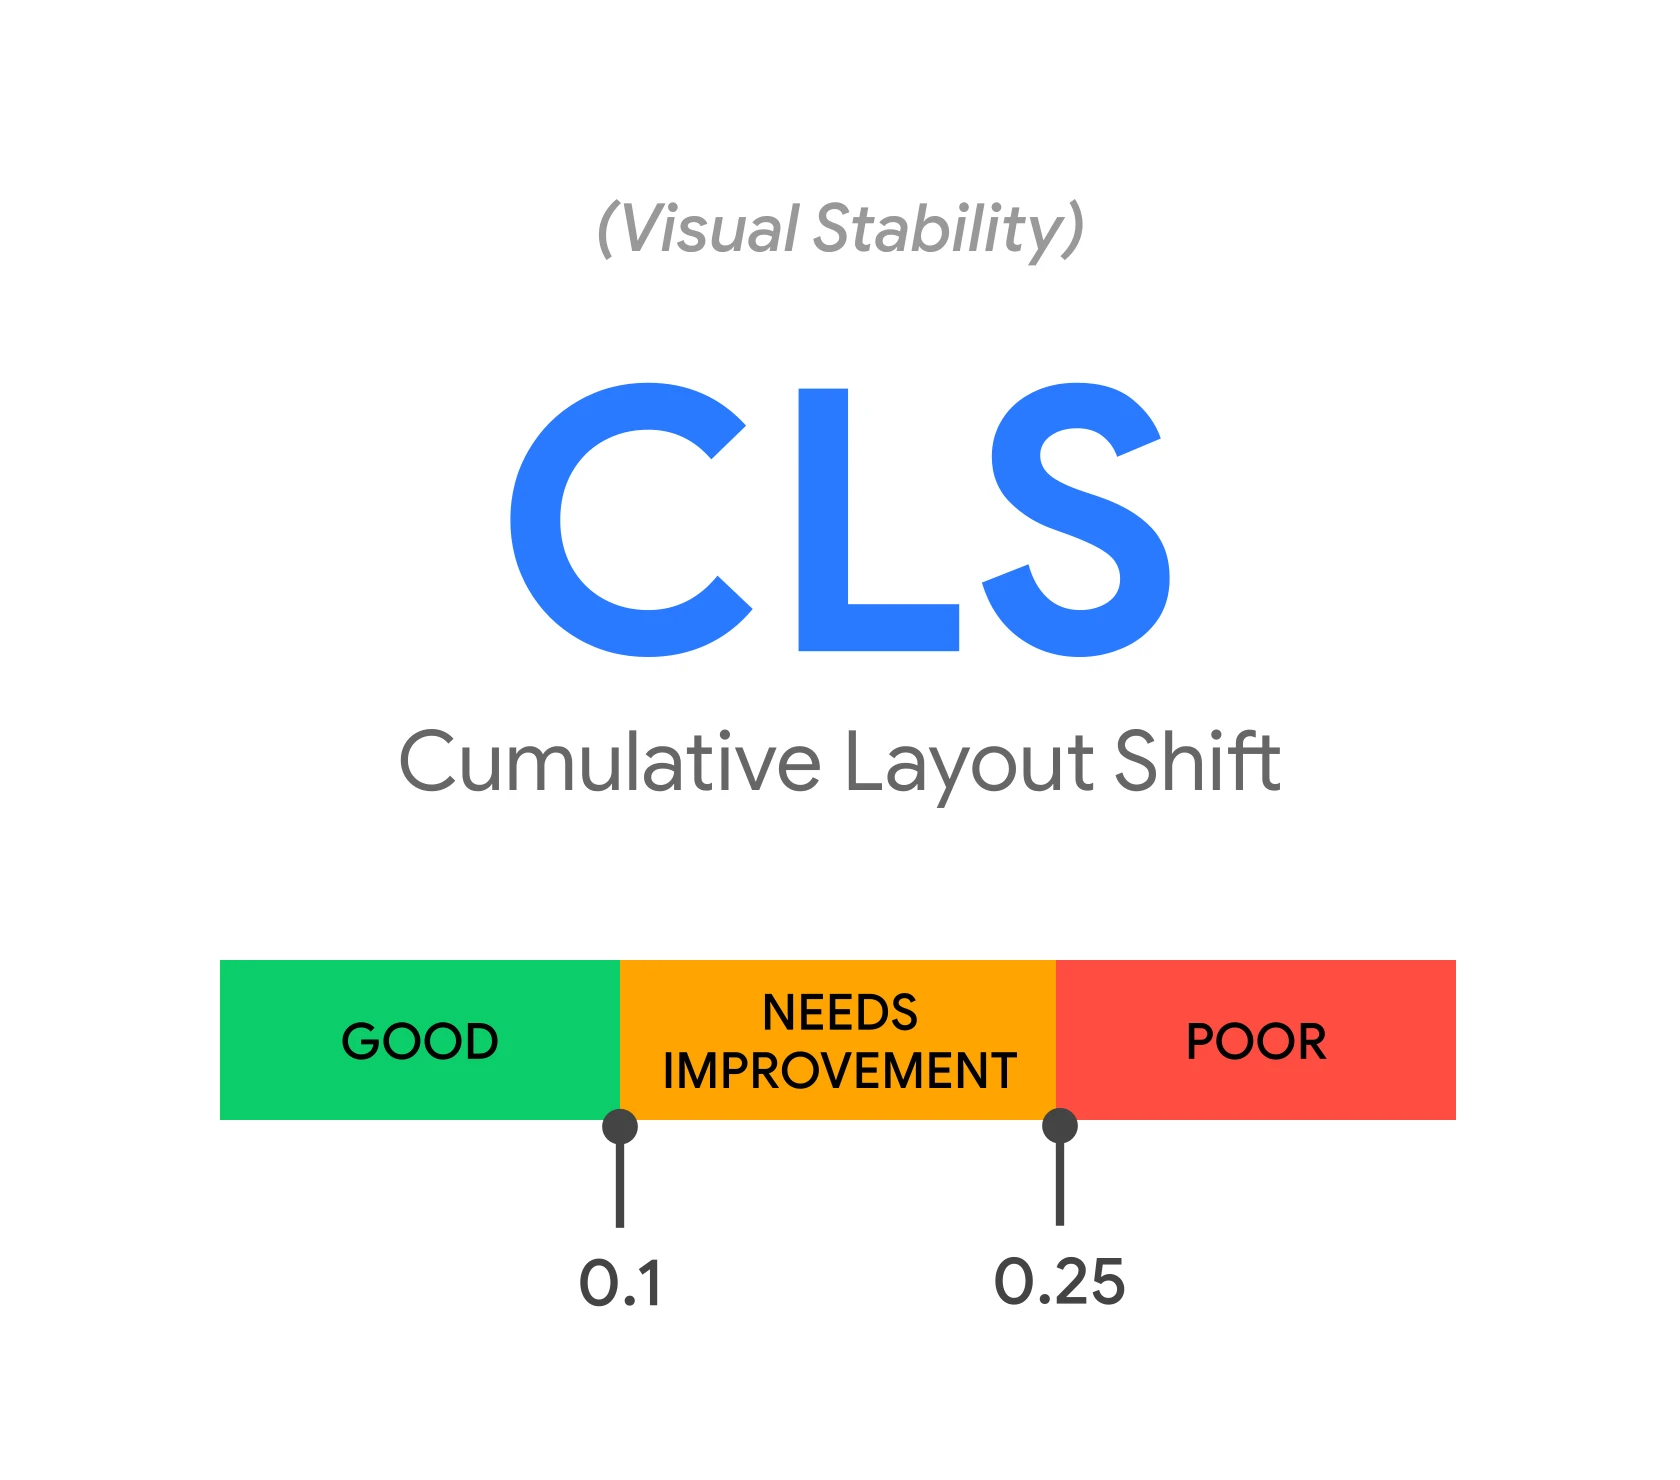
It is worth noting that LCP works closely with the other Core Web Vitals metrics. CLS is responsible for layout stability, while FID measures delays in responding to user actions. Together, these three metrics create a full picture of website performance. Fine-tuning them appropriately ensures faster page loading and a better experience for visitors.
The impact of LCP on user experience
Largest Contentful Paint (LCP) plays a key role in user experience by measuring how quickly the main content of the page becomes visible. The ideal LCP time is less than 2.5 seconds. Results in the range 2.5–4 seconds are considered average, while anything above 4 seconds can lead to frustration and an increase in the number of people leaving the site.
Research shows that pages with a short LCP time attract more engaged visitors. For example, websites loading within 2 seconds record a 15% lower bounce rate compared with those that take more than 3 seconds. A longer LCP time also affects conversions – even a one-second delay can reduce them by 7%.
That is why LCP optimisation is important not only for SEO, but also for user satisfaction. Displaying the main content quickly encourages visitors to stay on the page and return to it more often. It is a simple way to improve results and deliver a positive experience.
Why is LCP important for SEO?
LCP (Largest Contentful Paint) is one of the most important factors affecting a website’s SEO rankings in search results. Since 2021, Google has included it in Core Web Vitals, which means that improving this metric has a direct impact on SEO rankings. Pages that load quickly and achieve an LCP score below 2.5 seconds are assessed more favourably by search engine algorithms, which can result in higher positions in the SERPs.
Page loading speed not only affects SEO, but also significantly shapes user experience. Research indicates that sites with a short LCP time attract more engaged visitors and record a lower bounce rate. For example, pages loading within 2 seconds have 15% fewer people leaving the page compared with those that take more than 3 seconds to do so. This translates not only into better business results, but also higher conversion rates.
Google treats LCP as an important element of page quality assessment. Algorithms promote sites that deliver fast and smooth user experiences, so optimising this metric not only improves visibility in search results, but also increases visitor satisfaction. This is a key factor for long-term online success.
It is worth remembering, however, that LCP does not work in isolation – it is part of a broader set of Core Web Vitals metrics, such as First Input Delay (FID) and Cumulative Layout Shift (CLS). Together, they create a comprehensive picture of a website’s performance. Strong results across all three areas can have a significant impact both on a site’s ranking position and on its ability to attract and retain users.
Optimising LCP is an important element of an SEO strategy due to its impact on both Google’s algorithms and user experience. Taking care of this metric is a key step towards improving a website’s visibility and increasing its business effectiveness.
The importance of LCP in the context of website SEO
LCP (Largest Contentful Paint) is one of the key factors affecting website SEO. Since 2021, it has been part of Core Web Vitals, which means that its optimisation has a direct impact on a site’s visibility in Google search results. Pages achieving an LCP score below 2.5 seconds are assessed more favourably by algorithms, which can result in higher positions in the SERPs.
Page loading speed has a real impact on user experience. Research indicates that sites with an LCP time below 2 seconds record a 15% lower bounce rate compared with those that need more than 3 seconds to do so. This, in turn, translates into conversions – even a one-second delay can reduce them by as much as 7%.
For Google, LCP is an important element of page quality assessment. Algorithms favour sites that provide users with fast and smooth experiences. That is why optimising this metric not only improves visibility in search results, but also increases visitor satisfaction. It is worth remembering, however, that LCP works in conjunction with other Core Web Vitals metrics, such as First Input Delay (FID) and Cumulative Layout Shift (CLS). Together, they create a comprehensive picture of website performance.
Strong results across all three areas can have a significant impact both on a site’s ranking position and on its ability to attract and retain users. Optimising LCP is an important element of an SEO strategy due to its impact on both Google’s algorithms and user experience. Taking care of this metric is a key step towards improving a website’s visibility and increasing its business effectiveness.
How does LCP affect SEO rankings?
LCP (Largest Contentful Paint) plays a key role in SEO rankings. Since 2021, Google has recognised this metric as one of the most important elements of Core Web Vitals. Pages that achieve a score below 2.5 seconds are assessed more favourably by search engine algorithms, which can result in higher positions in the search results (SERP).
Research indicates that sites with a short LCP time attract more engaged visitors. For example, pages loading within 2 seconds record 15% fewer cases of leaving than those that need more than 3 seconds to do so. This not only translates into better business results, but also increases conversion rates.
Google treats LCP as an important factor in assessing page quality. Algorithms favour sites that deliver fast and smooth user experiences. Optimising this metric not only improves visibility in search results, but also increases visitor satisfaction. It is worth remembering, however, that LCP works in conjunction with other Core Web Vitals metrics, such as First Input Delay (FID) and Cumulative Layout Shift (CLS). Together, they create a comprehensive picture of website performance.
Strong results across all three areas can have a significant impact both on a site’s ranking position and on its ability to attract and retain users. Optimising LCP is an important element of an SEO strategy due to its impact on both Google’s algorithms and user experience. Taking care of this metric is a key step towards improving a website’s visibility and increasing its business effectiveness.
How to measure and analyse LCP?
Measuring and analysing LCP (Largest Contentful Paint) are essential in order to assess how quickly the main content of a page becomes visible to visitors. This can be tested both in controlled lab conditions and on the basis of data from real user sessions (RUM).
Lab tools such as Google Lighthouse, Chrome DevTools or WebPageTest allow you to simulate page loading in a stable environment. They make it possible to detect issues affecting performance, such as server response delays or inefficient resources. Lighthouse provides detailed reports, highlighting elements that slow down rendering and suggesting specific improvements.
On the other hand, Real User Monitoring (RUM) focuses on data from real user sessions. Tools such as Google Search Console or PageSpeed Insights show how the site behaves under different network conditions and on different devices. This makes it possible to better understand real user experiences.
Interpreting LCP results is based on simple rules:
- a score below 2.5 seconds is considered optimal,
- a score between 2.5 and 4 seconds signals the need for improvement,
- a score above 4 seconds is unfavourable and may negatively affect both SEO and user satisfaction.
Regularly tracking LCP values using these tools allows you to quickly detect issues and implement the necessary optimisations. This, in turn, translates into better site performance and higher positions in search results.
Methods of measuring LCP
To measure LCP, there are several tools and methods that may prove helpful. The simplest solution is to use Chrome DevTools in the Chrome browser. All you need to do is open the page in incognito mode, launch the developer tools (F12), go to the Lighthouse tab and run an analysis. Lighthouse generates a detailed report that not only shows the LCP time, but also identifies elements affecting site performance.
Another useful tool is PageSpeed Insights. After entering the URL, the tool analyses the page and provides information about Core Web Vitals metrics, including LCP. It also offers practical optimisation suggestions that can help improve results.
If you want to examine the site’s behaviour more closely under different network conditions or on different devices, it is worth using WebPageTest. This tool allows you to simulate page loading in different scenarios and provides detailed data on the rendering time of individual elements. This makes it easier to identify issues affecting LCP.
For a more advanced analysis, it is worth considering using Real User Monitoring (RUM), which collects data from real user sessions. Tools such as Google Analytics or Search Console provide valuable insights into how the site behaves in practice. This allows you to better understand user experiences and tailor optimisations to their needs.
When interpreting the results, remember that the optimal LCP time should be less than 2.5 seconds. Results between 2.5 and 4 seconds signal the need for improvement, while values above 4 seconds may negatively affect both SEO and user satisfaction. Regular monitoring of these values allows you to respond quickly to issues and implement the necessary changes for better site performance.
Tools for analysing LCP: PageSpeed Insights, Lighthouse
Tools such as PageSpeed Insights and Lighthouse are key to analysing LCP (Largest Contentful Paint). Both provide detailed reports that help identify elements affecting the time it takes for the largest visible element on the page to appear.
PageSpeed Insights offers a comprehensive performance analysis, including LCP values, while also indicating areas requiring optimisation. It works both in lab mode and on the basis of data from real user sessions (RUM), which makes it possible to better understand site behaviour under different conditions.
Meanwhile, Lighthouse, available in Chrome DevTools, enables in-depth performance analysis. It generates reports containing information about LCP time and points to specific issues, such as server response delays or inefficient resources, which makes it easier to implement fixes quickly.
Both tools are easily accessible and free of charge, which makes them indispensable for every webmaster who cares about performance optimisation. Using them regularly allows you to monitor LCP results and respond to any issues, which translates into better user experiences and higher positions in search results.
LCP values and their interpretation
The LCP (Largest Contentful Paint) value plays a key role in assessing website performance. According to Google’s recommendations, the optimal loading time for the main content should be shorter than 2.5 seconds. Results within the 2.5–4 seconds range indicate the need for optimisation, while values exceeding 4 seconds are considered unacceptable and can significantly lower the site’s position in search results and discourage users.
Interpreting the results is intuitive:
- less than 2.5 seconds – the page works efficiently and provides fast loading of key elements,
- 2.5–4 seconds – this is a warning sign; it is worth looking at the factors affecting performance,
- above 4 seconds – immediate corrective action is necessary.
Useful tools for monitoring LCP include PageSpeed Insights, Lighthouse and Chrome DevTools. They make it possible to quickly identify issues and implement the necessary fixes. This not only improves user experience, but also increases the site’s visibility in search engines. Regular analysis is the foundation of effective optimisation!
Most common causes of a poor LCP score
Poor LCP (Largest Contentful Paint) results are often the effect of technical issues that make it harder to load key page elements quickly. One of the main culprits is long server response time, caused by overload, inefficient configuration or a lack of database optimisation. The longer the time to first byte (TTFB – Time to First Byte), the greater the delay in displaying the main content.
Another challenge is render-blocking resources, such as large JavaScript and CSS files. If these scripts load before the main content, they can significantly slow down page rendering. In addition, unoptimised JavaScript code can lengthen execution time, which negatively affects overall performance.
Unoptimised images are another common issue affecting LCP. High-resolution images without compression or without using modern formats (e.g. WebP) can significantly increase load time. Failing to adapt image dimensions to the user’s screen additionally burdens resources.
For sites using JavaScript frameworks, client-side rendering can be another source of delays. If the site needs to fetch and process a large amount of data before displaying content, LCP can be significantly extended.
It is also worth paying attention to the lack of resource prioritisation. When key page elements are not loaded first, and their fetching is blocked by other resources, the LCP result deteriorates. Implementing techniques such as preload for the most important resources can help solve this problem.
A poor LCP score often results from a combination of factors: slow server response time, render-blocking scripts and styles, and unoptimised images. Identifying and eliminating these issues is a key step in improving site performance and delivering a better user experience.
Rendering and render-blocking resource issues
Rendering and render-blocking resource issues are among the main causes of poor LCP (Largest Contentful Paint) results. Unoptimised CSS and JavaScript files can significantly delay the display of the page’s main content. When the browser first has to fetch and process these resources, the rendering process is paused, which lengthens the LCP time.
The biggest problem is blocking JavaScript scripts. They must be loaded before the content is displayed. If scripts are large or inefficiently written, they slow down the whole process. The same applies to render-blocking CSS. Styles must be loaded before content is displayed, which can delay LCP, especially when CSS files are large or not split into smaller parts.
To reduce the impact of these resources on LCP, it is worth applying several optimisation techniques:
- minification and compression of CSS and JavaScript files – reducing their size speeds up fetching,
- asynchronous loading of scripts – using the async or defer attribute allows parallel loading without blocking rendering,
- splitting CSS into critical and non-critical code – critical styles should be embedded directly in HTML to enable faster content display,
- removing unnecessary resources – eliminating unused code or style fragments can significantly improve performance.
It is also worth considering implementing preload, which prioritises key resources such as images or fonts. This allows the browser to fetch them faster and render the main page content.
Optimising render-blocking resources is a key step in improving LCP. Faster page loading translates into a better user experience and higher positions in search results.
Slow server response time and Time to First Byte
Slow server response time and a long Time to First Byte (TTFB) are among the main factors contributing to poor Largest Contentful Paint (LCP) results. Server response time measures the period from the browser sending a request to receiving the first byte of data. If this process takes too long, it delays the display of the page’s key content, which negatively affects both user experience and SEO.
TTFB plays a key role because it is the first stage of page loading. A value above 600 ms is considered unsatisfactory and can significantly extend LCP time. The causes of slow TTFB can vary – from server overload, through inefficient database configuration, to a lack of effective use of caching technology.
To improve server response time and TTFB, it is worth taking several important steps:
- optimise server configuration by adjusting PHP, MySQL or other services settings,
- implement a Content Delivery Network (CDN), which shortens the distance between the user and the server by delivering content from the nearest access point,
- use page caching mechanisms such as Varnish or Redis to speed up content delivery,
- reduce the number of database queries by optimising code and properly indexing tables.
Additionally, it is worth regularly monitoring server performance with tools such as Google PageSpeed Insights or Lighthouse. These tools indicate areas that need improvement, which allows you to react quickly to issues and maintain optimal LCP results.
Improving server response time and TTFB not only enhances user experience, but also contributes to higher positions in Google search results. These actions are crucial for effective website performance optimisation.
Unoptimised images and scripts
Unoptimised images and scripts are among the main causes of poor LCP (Largest Contentful Paint) results. Uncompressed graphics or those saved in outdated formats can significantly lengthen page load time. Large graphic files without proper optimisation require more time to download, which delays the display of key content. It is worth opting for modern formats such as WebP, which offer better compression while maintaining high image quality.
JavaScript scripts can also negatively affect LCP, especially when they are too large or block page rendering. If the browser has to load and execute scripts before showing the content, this process extends LCP time. To prevent this, it is worth using techniques such as asynchronous loading (via the async or defer attributes) and code minification, which reduces JavaScript file size.
Prioritising resources also plays a key role. The most important elements of the page should be loaded first, and their retrieval must not be blocked by other resources. Implementing techniques such as preload for key images or fonts can significantly speed up the display of the main content.
Optimising images and scripts is an essential step in improving LCP. Faster page loading translates not only into a better user experience, but also into higher positions in Google search results.
How to improve LCP?
To improve LCP (Largest Contentful Paint), it is worth looking at several key aspects. Start with image optimisation, as images often make up the largest element on the page. Modern formats such as WebP offer better compression without loss of quality, and resizing graphics to match the user’s screen further speeds up loading. It is also worth applying lazy loading so that the browser does not have to fetch all resources straight away.
The next important step is optimising JavaScript and CSS code. Large files can significantly slow down page rendering, so it is worth minifying and compressing them. JavaScript scripts can be loaded asynchronously or deferred using the async or defer attributes. In the case of CSS, critical styles are best embedded directly in the HTML, while the rest should be loaded later.
Implementing a Content Delivery Network (CDN) is another way to speed up LCP. A CDN shortens the distance between the user and the server by delivering content from the nearest available point. This is especially important for sites with a global audience.
Prioritising resources also plays a key role. The most important page elements, such as images or fonts visible above the fold, should be loaded first. This can be achieved by using the preload technique for key resources.
Don’t forget to improve the server response speed (Time to First Byte – TTFB). Slow response time can lengthen LCP, so it is worth optimising the server configuration and using caching mechanisms. Regular performance monitoring with tools such as Google PageSpeed Insights or Lighthouse will help maintain good results.
Improving LCP not only has a positive impact on the user experience, but also contributes to higher positions in Google search results. The key to success is regular optimisation and continuous monitoring of site performance.
Image and graphic optimisation
Image and graphic optimisation plays a key role in increasing website performance, especially in the context of the Largest Contentful Paint (LCP) metric. Since images often make up the largest element on a page, preparing them properly can significantly speed up the loading of the main content.
The first step is compression of graphic files. This makes it possible to reduce image size without loss of quality. It is worth opting for modern formats such as WebP, which provide better compression than traditional JPEG or PNG. In addition, adjusting image dimensions to the user’s screen eliminates the download of unnecessary data.
Another important aspect is responsive graphics. Images should be adapted to different screen resolutions, which can be achieved by using the srcset attribute in HTML. This allows the browser to automatically choose the appropriate image size for the given device.
Implementing lazy loading also contributes to improving LCP. It allows images below the fold to be loaded later, reducing the load on the page during the initial rendering.
Don’t forget about prioritising resources. Key images visible above the fold should be loaded first. This can be achieved by using the preload technique in the HTML code.
The final step is to remove unnecessary graphics or replace them with more efficient alternatives, such as SVG icons instead of bitmap PNG files. This further reduces the amount of data to download and speeds up page rendering.
Thanks to image and graphic optimisation, we not only improve LCP results, but also affect the overall performance of the site and user satisfaction. The site becomes more user-friendly and is rated better by search engine algorithms.
JavaScript and CSS code optimisation
Optimising JavaScript and CSS code plays a key role in improving website performance, especially in the context of the Largest Contentful Paint (LCP) metric. Inefficient code can significantly slow down rendering, which directly affects the time it takes for the main content to appear. How can this be fixed?
The first step is minifying JavaScript and CSS files. This process involves removing unnecessary characters such as spaces, comments or unused code fragments. As a result, file sizes shrink and they load faster. Minification can reduce script sizes by as much as 30-50%, which significantly speeds up page loading.
Another important aspect is asynchronous loading of JavaScript files. By default, the browser blocks page rendering until all scripts have loaded. Using the async or defer attributes allows scripts to load in parallel without blocking the rendering process. The async attribute enables a script to be fetched in the background, with execution happening immediately after it loads. By contrast, defer delays script execution until the HTML document has finished parsing.
For CSS, it is worth using the technique of splitting styles into critical and non-critical. Critical styles, which are necessary to render above-the-fold content, should be embedded directly in the HTML code. The remaining styles can be loaded later, which speeds up the initial rendering process.
It is also worth considering removing unnecessary resources, such as unused code fragments or styles. Tools such as Lighthouse or PageSpeed Insights can help identify unnecessary elements.
File compression is another way to improve performance. Using technologies such as Gzip or Brotli makes it possible to significantly reduce the size of JavaScript and CSS files before they are sent to the user’s browser.
The final step is implementing preload for key resources such as fonts or above-the-fold images. This allows the browser to fetch these elements more quickly and render the main page content.
Optimising JavaScript and CSS code not only improves LCP results, but also affects overall website performance and user satisfaction. Faster loading translates into a better visitor experience and higher positions in Google search results.
Implementing lazy loading
Lazy loading is one of the most effective techniques for optimising website performance. It has a particularly positive impact on the Largest Contentful Paint (LCP) metric, which measures the time it takes for the most important elements of a page to appear. Instead of fetching all images and resources at once, the browser only loads them when the user scrolls the page and gets close to them. This makes the page work faster, and visitors do not have to wait for content they do not need at that moment to load.
This technique is especially useful on sites containing many images, such as galleries or blogs. Rather than burdening the browser with all photos at once, lazy loading focuses only on the elements that are visible “above the fold” (above the fold). The remaining resources are fetched dynamically as the page is scrolled.
Implementation is simple – just add the loading="lazy" attribute to <img> or <iframe> tags. Modern browsers support this feature natively, so there is no need to write additional JavaScript code. Example:
<img src="obraz.jpg" loading="lazy" alt="Opis obrazu">
For more advanced use cases, you can use tools such as Intersection Observer API, which allow precise control over when resources are loaded and support complex scenarios.
Why is it worth using lazy loading?
- it significantly improves LCP results, which translates into a better user experience,
- it reduces data usage for people using mobile devices,
- it reduces server load.
This simple solution can have a huge impact on site speed and visitor satisfaction.
Using Content Delivery Network (CDN)
Implementing a Content Delivery Network (CDN) is an effective way to increase website performance, especially in the context of the key Largest Contentful Paint (LCP) metric. By distributing resources such as images, scripts or CSS styles to servers located closer to users, the time needed to fetch them is significantly reduced. As a result, the main content appears faster, which has a positive impact on user experience.
One of the biggest advantages of a CDN is minimising delays resulting from the distance between the user and the server. Resources are delivered from the nearest access point, which shortens response times and speeds up site rendering. This is particularly important for sites with a global reach, where visitors may be located in different parts of the world.
A CDN also has a positive effect on Time to First Byte (TTFB), that is, the time it takes to receive the first byte of data. Faster delivery of resources translates into shorter page load times and better LCP results. In addition, many CDN networks offer caching mechanisms that speed up access to content even further.
Another benefit is reducing the load on the main server. By distributing traffic across many CDN servers, the site’s infrastructure is less burdened, which can prevent overloads and improve site stability.
Implementing a Content Delivery Network is a key element of website performance optimisation. It shortens resource load times, improves LCP and TTFB results, and increases user satisfaction. This solution is particularly recommended for high-traffic sites or those aimed at an international audience.
Prioritising resources and preloading content
Resource prioritisation and preload are key techniques that have a significant impact on website performance. They are particularly important in the context of improving the Largest Contentful Paint (LCP) metric, which has a direct impact on user experience and SEO. Prioritisation is about determining which elements of the page are the most important and should be loaded first. This can apply to images visible “above the fold”, fonts or scripts necessary for correct rendering. As a result, the browser displays the key parts of the site faster, which translates into better LCP results. The preload technique, on the other hand, allows important resources to be fetched earlier, before the browser actually needs them. This can be achieved by adding the attribute “ to the HTML code. For example, if a page contains a large image visible as soon as it loads, it is worth marking it as priority: “`html “` This means the browser will start fetching that resource right at the beginning of the page loading process, instead of waiting to discover it in the HTML code. Preload works particularly well in the case of:
- images visible “above the fold”,
- fonts used in the main sections of the site,
- critical JavaScript or CSS scripts.
It is worth remembering, however, that excessive use of this technique can lead to network overload and slower loading of other elements. That is why it should be used sensibly, focusing only on the most important resources. The best results are achieved by combining prioritisation and preload with other optimisation methods, such as file compression or the use of modern image formats (e.g. WebP). This makes the page more responsive and user-friendly, which translates not only into better LCP results, but also higher positions in Google search results.
File compression and code minification
File compression and code minification are essential tools in optimising website performance. They are particularly important in the context of improving the Largest Contentful Paint (LCP) metric, which determines how quickly the user sees the main content of the page. These techniques can significantly reduce the size of resources, which translates into faster loading.
File compression is the process of reducing the size of HTML, CSS, JavaScript and image files using algorithms such as Gzip or Brotli. This means the browser downloads less data, which shortens the time needed to display the page. For example, compressing CSS and JavaScript files can reduce their size by as much as 30-50%, which directly affects rendering speed.
Code minification, on the other hand, involves removing unnecessary elements from JavaScript and CSS files – spaces, comments or unused code fragments. This process not only reduces file size, but also speeds up processing by the browser. Even a slight reduction in script execution time by a few milliseconds can have a significant impact on overall page performance.
It is also worth paying attention to asynchronous script loading. This technique allows resources to be fetched in parallel without blocking page rendering. The async or defer attributes enable scripts to load in the background, which translates into faster display of key site elements.
Another important element is the use of a Content Delivery Network (CDN). A CDN distributes resources from servers located closer to the user, which significantly shortens data fetching time and has a positive effect on LCP results.
Optimisation through compression and minification not only improves user experience, but also contributes to better positions in Google search results. Regular performance monitoring using tools such as PageSpeed Insights or Lighthouse helps maintain optimal LCP results and react quickly to any issues.
Removing render-blocking resources
Optimising website performance often starts with removing render-blocking resources, which is crucial for improving the Largest Contentful Paint (LCP) metric. This metric measures the time needed to display the main content, and any delay can negatively affect both user experience and SEO. The main culprits are often unoptimised CSS and JavaScript files, which slow down the entire process.
JavaScript scripts are one of the biggest challenges. Since they must be loaded before the content is displayed, their size or inefficiency can significantly slow down rendering. Render-blocking CSS works in a similar way – styles have to be loaded before content is shown, which is particularly problematic in the case of large or unsplit CSS files.
To minimise the impact of these resources on LCP, it is worth applying several proven methods:
- minification and compression of CSS and JavaScript files – reducing their size speeds up fetching,
- asynchronous script loading – using the async or defer attributes allows parallel loading without blocking rendering,
- splitting CSS into critical and non-critical code – embedding critical styles directly in the HTML speeds up content display,
- eliminating unnecessary resources – removing unused code fragments or styles can significantly improve performance.
It is also worth considering the use of preload, which prioritises key resources such as images or fonts. This allows the browser to fetch and render the main content of the page faster.
Optimising render-blocking resources is not only a way to improve LCP, but also the key to better user experience and higher positions in search results. Regular analysis and optimisation of these elements are the foundation of smooth operation for any website.
Improving server response time
Improving server response time plays a crucial role in optimising the Largest Contentful Paint (LCP) metric. A shorter page load time not only has a positive effect on user experience, but also contributes to higher positions in search results. Here are a few effective ways to help achieve this goal:
- Adjusting server configuration
Changing settings such as PHP, MySQL or Apache can significantly speed up the site. It is also worth keeping the software up to date and implementing caching solutions such as Varnish or Redis. - Using a Content Delivery Network (CDN)
CDN enables the distribution of assets from servers located closer to the user, which shortens content delivery time and minimises delays caused by geographic distance. - Reducing Time to First Byte (TTFB)
To shorten the wait for the first byte of data, it is worth optimising database queries, limiting the number of HTTP requests and using page caching mechanisms. - Optimising connections to external resources
If the site uses elements such as Google Fonts fonts, it is worth speeding up their loading by using the HTTP/2 protocol or the preload technique. - Regular performance monitoring
Tools such as Google PageSpeed Insights or Lighthouse make it possible to track server performance on an ongoing basis and react quickly to issues affecting LCP.
Implementing these changes can significantly improve server response speed, which directly translates into better LCP results and greater visitor satisfaction.
Monitoring and optimising LCP
Tracking and optimising LCP (Largest Contentful Paint) are key elements affecting website performance. With regular monitoring of results, you can quickly detect issues and make the necessary fixes, which translates into a better user experience and a higher position in search results.
For LCP analysis, it is worth using tools such as Real User Monitoring (RUM) and Chrome User Experience Report. The first of these provides data from real sessions, showing how the site behaves under different network conditions and on different devices. The second tool offers aggregated statistics, allowing you to compare your website’s performance with others.
Regular tests using solutions such as PageSpeed Insights or Lighthouse are also essential. These platforms not only measure the time it takes for the largest visible element to appear, but also indicate specific areas requiring improvement. This makes it possible to react quickly to issues such as server response delays or render-blocking resources.
For webmasters, monitoring LCP is particularly important because it allows them to assess the impact of implemented changes on site performance. For example, after optimising images or JavaScript scripts, it is worth checking whether the LCP time has been reduced. Regular data analysis also helps identify trends and potential issues before they become more serious.
Optimising LCP is an ongoing process – even small changes in the code or server configuration can have a significant impact on results. That is why systematic monitoring and testing are key to maintaining high performance and ensuring positive user experiences.
Real User Monitoring (RUM) and Chrome User Experience Report
Real User Monitoring (RUM) and Chrome User Experience Report (CrUX) are powerful tools that provide valuable information about user experiences. RUM collects data from real sessions, showing how the site performs under different network conditions and on different devices. This allows you to track precisely the factors affecting the time it takes for the largest visible element (LCP) to appear, as well as other key performance metrics.
By contrast, CrUX is a dataset aggregated by Google that shows how Chrome users perceive your website. This report includes information on important metrics such as:
- LCP (Largest Contentful Paint),
- FID (First Input Delay),
- CLS (Cumulative Layout Shift).
It allows you to compare your site’s results with others and assess its standing against global performance standards.
Both tools are key for monitoring and optimising LCP. RUM enables in-depth analysis of issues in real-world conditions, while CrUX offers a broad overview of site performance on a global scale. Regular use of these solutions makes it possible to react quickly to issues and implement the necessary fixes. This in turn translates into a better user experience and higher positions in search results.
The importance of monitoring LCP for webmasters
Monitoring LCP (Largest Contentful Paint) is an important aspect for webmasters who care about their website’s performance and want to improve its visibility in search results. Through regular analysis of this metric, it is possible to identify issues on an ongoing basis, such as render delays or inefficient resources, which affect the time it takes for the main content to appear. Quickly implementing fixes not only improves the quality of the user experience, but also contributes to better positions in the SEO rankings.
Tools such as Google PageSpeed Insights, Lighthouse or Real User Monitoring (RUM) are useful for effectively tracking LCP. They not only measure the time it takes for the largest element on the page to appear, but also indicate specific areas requiring optimisation. Thanks to them, you can react quickly to issues such as slow server response or resources blocking the rendering process.
Testing and analysis are particularly important after changes have been made to the site, e.g. after optimising images or JavaScript scripts. They make it possible to assess whether the changes have delivered the expected effect in the form of a shorter LCP time. Systematic monitoring of data also helps identify trends and potential issues before they become more serious.
For webmasters, tracking LCP is not only a way to improve site performance, but also a tool for building better user experiences. Faster loading of the main content translates into a lower bounce rate and greater visitor engagement, which directly affects business results and search engine rankings.
LCP optimisation is an ongoing process – even small changes to the code or server configuration can significantly improve results. That is why regular monitoring and testing are crucial for maintaining high performance and ensuring users have positive experiences when using the site.
Regular PageSpeed tests and how to interpret them
Carrying out PageSpeed tests regularly is a key element of looking after a website’s performance. One of the most important metrics is Largest Contentful Paint (LCP), which determines how quickly the largest visible element on the page appears on the user’s screen. To get detailed information on this, it is worth using tools such as Google PageSpeed Insights or Lighthouse. Their reports help identify issues affecting LCP, such as server response delays, unoptimised images or render-blocking resources. To interpret test results correctly, it is necessary to know the key values. The optimal LCP time should be less than 2.5 seconds. Results in the range of 2.5–4 seconds signal the need for improvements, while values above 4 seconds are considered unsatisfactory and may negatively affect both user experience and the site’s position in search results. Analytical tools often provide specific optimisation recommendations. If the report highlights image issues, it is worth considering compressing them or switching to modern formats such as WebP. In the case of JavaScript files, it is recommended to minify them and load them asynchronously using the async or defer attributes. Systematically carrying out tests makes it possible to monitor the effectiveness of the changes introduced. After optimising images or scripts, it is worth analysing the LCP results again to make sure the modifications have delivered the expected results. This makes it possible to react quickly to any issues and continuously improve the site’s performance. Regular PageSpeed testing and analysing the results are an integral part of a website performance optimisation strategy. They not only help improve LCP metrics, but also increase user satisfaction and the site’s position in Google search results.
FAQ
Frequently asked questions
What significance does Largest Contentful Paint (LCP) have for a website’s SEO?
LCP has been one of Google’s ranking factors since 2021. A better score can improve a site’s visibility in search results.
Is an LCP score below 2.5 seconds good?
Yes, that time is considered optimal. Sites with such a result usually provide a better user experience and achieve better SEO results.
What does an LCP above 4 seconds mean?
Such a result is considered unsatisfactory. It can affect a drop in rankings and a higher bounce rate.
Which page elements count towards LCP?
LCP measures the time it takes for the largest visible element on a page to appear. This can be an image, video, heading or a large block of text visible above the fold.
How can LCP be measured on a website?
For analysis, you can use tools such as Chrome DevTools, Lighthouse, PageSpeed Insights and WebPageTest. Data from real user sessions, known as RUM, is also helpful.
Why does fast LCP affect user experience?
The faster the main content appears, the lower the risk of frustration and leaving the page. A shorter LCP time is also associated with a lower bounce rate and better engagement.