Assessing the growth potential of product categories has one goal: to know where it truly pays off to invest time, budget, and operational resources. It’s not about categories that already “look good” in sales reports, but those in which revenue or profit can be realistically increased. In practice, you need to stitch together sales data, margin, market demand, search engine visibility, and stock limitations into a coherent whole. The greatest potential often does not lie in top categories but in those with untapped demand, poor exposure, or conversion issues that can be fixed. And this is not a cliché but a repeatable pattern. Such an approach cuts off investing in areas that shine only at first glance. This means SEO, advertising, assortment expansion, and store changes are driven by data, not intuition.
What does assessing the growth potential of product categories involve?
Assessing the growth potential of product categories boils down to determining which categories have the best chance for further growth and, importantly, why. It’s a prioritisation process designed to answer where it is worth investing in SEO, paid campaigns, content, assortment development, or improving the category page itself. The aim is not to academically describe the market but to indicate actions that can deliver results. The question is: what specifically will push the category forward.

In practice, several areas are analysed simultaneously: sales, margin, number of orders, average basket value, seasonality, product availability, returns, and the category’s share of overall revenue. Added to this are data on traffic, search visibility, and user behaviour on the site. High sales alone do not yet indicate great growth potential. A category may already be close to its ceiling or operate on too low a margin, which sounds like success but often acts as a brake.
The key is to separate strong categories from those with untapped potential. Such a gap takes various forms: high demand with low visibility, high traffic with poor conversion, or good conversion with low exposure. It is these discrepancies between demand, traffic, and sales results that most often reveal where real growth reserves lie. Put differently: winning is not about who has the current result but who still has room for tomorrow.
The assessment also concerns the quality of growth, not just its scale. If a category is growing but has a high rate of returns, unstable supply, or very low profit, its attractiveness simply decreases. But beware, this is not a minor detail to add in the footer of a report. That’s why a good analysis ends not with a popularity ranking but with a list of categories backed by justification: what is growing, what blocks results, and which growth lever makes the most sense.
Current decision-making context in category analysis
The current decision-making context in category analysis is that historical sales have ceased to be sufficient as the sole basis for setting priorities. Demand changes faster because it is mixed with seasonality, search trends, price changes, availability, and how users browse the offer on mobile. The facts are: a good category from last year doesn’t have to be the best investment spot today. And if someone still relies solely on “yesterday’s results,” they risk burning the budget quietly.
In many stores, the greatest potential lies not in the categories already delivering the lion’s share of revenue but in those losing results at the exposure or conversion stage. This is visible in categories with a high number of impressions and low CTR, as well as those with solid traffic but barely moving sales. If users see a category but still don’t click or buy, the usual culprits are the title, offer, filters, price, or product presentation—not the demand itself.
Often, the real potential is decided by the mundane: data quality and order within the store structure. In short, poor filtering, incomplete attributes, poorly constructed URLs, sparse descriptions, or indexing problems can block even high demand. The same applies to product feeds and data upon which advertising campaigns are then based. A good category without a complete structure and data regularly loses to an average category that is simply better technically prepared.
Not every growing category is suitable for scaling. Sometimes the brake is low margin, sometimes a small number of products, sometimes high returns. There are also long delivery times and unstable stock levels—risks not visible in a report saying “trend is rising.” Therefore, the analysis must combine data from the analytics platform, sales system, warehouse, SEO results, advertising campaigns, and search trends. Only such a complete picture allows assessment of whether growth is possible, profitable, and operationally feasible.
How does growth potential analysis proceed in practice?
In practice, growth potential analysis boils down to comparing each category regarding demand, sales results, visibility, margin, and operational constraints, then prioritising actions. First, the goal is set because the category is assessed differently when revenue growth is the priority than when margin, customer acquisition, or stock liquidation is the focus. Without one clearly defined goal, it’s easy to identify a category that looks great in reports but doesn’t solve a real business problem.
The next step is less flashy but crucial: organising data so that categories can be compared on the same terms. In practice, this means consistent category names, correct product assignment, sales history, and information on prices, costs, returns, stock levels, and traffic sources. If this data is inconsistent, the analysis results will be misleading regardless of how refined the scoring model is. Here, the winner is not the „smarter algorithm” but better data hygiene.
The next stage is analysis of internal category results. You look not only at revenue but also at the number of orders, conversion rate, average basket value, revenue share, margin, returns, and month-on-month and year-on-year change dynamics. This really shows whether the category is growing healthily or merely riding a temporary promotion, seasonality, or price increase.
Then comes external demand and visibility analysis. This stage determines whether the market is genuinely searching for products in the category, how seasonal query volumes behave, and whether the store has landing pages that effectively meet these intents. The three most valuable situations are usually: high demand with low visibility, high traffic with poor conversion, or good conversion with insufficient exposure.
On the SEO and exposure side, there is no room for guesswork. You check whether the category is indexed, if it has a sensible URL structure, whether filters match real search methods, and if descriptions and meta data don’t undermine CTR. In parallel, there is an audit of the offer because even the best visibility can be ineffective without it: assortment breadth, attribute completeness, variants, images, reviews, availability, and feed readiness for product campaigns. In many online stores, potential gets lost not due to lack of demand but poor presentation or patchy data. That is the most frustrating because it is a fixable problem, not a market verdict.
At the finish line, each category should receive a practical label. A specific one, not descriptive: SEO potential, paid traffic potential, conversion improvement potential, assortment expansion potential, margin potential, or operational risk. To keep it coherent, a simple scoring based on several criteria is used, not just one indicator that looks good in a report. The best priorities combine high impact with realistic implementation feasibility within a reasonable timeframe.
After implementation, the work does not end. That’s when the reality test begins: you measure changes in traffic, visibility, CTR, conversion, revenue, margin, and availability, otherwise you won’t distinguish growth from seasonal upswing or short-term promotion. This is especially crucial where demand fluctuates and the assortment rotates quickly and without sentimentality.
What to do to effectively use category potential?
First, choose the right unit of analysis. Then attach concrete actions to it because otherwise, everything dissolves into generalities. A category that is too broad hides differences between product groups, while one that is too narrow produces unstable data and complicates decision-making. The most effective are usually subcategories or product groups that already have sufficient data volume but still show real differences in demand and conversion.
In practice, it pays off to separate categories with high demand from categories with high sales. This is not the same thing: high sales can result from exposure, promotions, or brand advantage rather than being a signal of market growth. Therefore, each category should be sliced by several dimensions simultaneously: demand, visibility, conversion, margin, and availability. The data clearly show that a single metric can be tempting but almost always misleads.
The most productive actions are targeted. First diagnose the gap, then apply tools. If a category has demand but no visibility, the priority will be SEO, category structure, filters, and content. If it has traffic but poor sales, the offer, pricing, merchandising, product data, trust, and UX need refining. If it sells well but has low visits, it makes sense to boost exposure in the menu, product campaigns, and cross-selling activities.
First, check whether the category can actually sustain operational scaling. Promoting a category with a small number of active products, unstable stock, high return rates, or poor margin can boost traffic but not necessarily business results. Not every growing category is a good investment category if the growth does not translate into profitability and repeat sales.
Without minimum entry requirements, the analysis becomes a lottery. Before you start, set thresholds and data scopes: sales, analytics, margin information, stock levels, category map, organic and paid traffic, and price and promotion history. But beware, constraints are equally important because they set the „ceiling” of conclusions: number of SKUs, data history length, seasonality, assortment volatility, and quality of traffic source tagging.
The final outcome should be useful. Ideally, it takes the form of a priority category list with justification, main growth levers, risks, and post-implementation monitoring metrics. The most common pitfalls are repetitive: assessing potential solely on revenue, ignoring margin and availability, mixing seasonality with long-term trends, and failing to separate brand and non-brand traffic. A good analysis does not end with indicating „what grows” but answers what exactly needs to change to actually leverage that growth.
What are the most common mistakes in assessing category potential?
The most typical mistake is assessing category potential solely by current revenue. A category may sell well only because it has strong exposure, a large advertising budget, or a broad assortment that „collects” various needs in one basket. This is still not proof that it has the best conditions for further growth. Potential shows the gap between current performance and the real possibility of improvement, not just the sales scale itself.
The second common mistake is confusing demand with what your own store currently supplies. If a given category has low turnover, it does not automatically mean the market is weak; rather, something is not working along the way. In practice, culprits often include low visibility in Google, poor filtering, incomplete product attributes, or simply too few active offers.
There is also a third sin. Analysing a single metric at a time, without the context of the others. High traffic without conversions usually signals problems with the offer, pricing, usability, or trust, not a “weak category”. Conversely, good conversion with low traffic suggests the category is underexposed and has room to scale. The best decisions are made only when you compare demand, visibility, conversion, margin, and availability simultaneously.
- Ignoring margin, return costs, and cost of traffic acquisition.
- Treating seasonal growth as a permanent trend.
- Combining brand and non-brand data into one result.
- Analysing categories that are either too broad or too narrow in scope.
- Omitting operational constraints, such as stock levels and delivery times.
In practice, categories that look good in marketing reports but are weak business-wise are often overestimated. If margin is low, returns are high, and availability unstable, increased traffic does not necessarily improve the company’s results. Not every category that can be promoted is worth scaling.
Another separate mistake is lacking validation after implementing changes. Without comparing periods, checking seasonality, and assessing the impact of promotions, it is easy to mistake random growth for a strategy’s success. This leads to incorrect conclusions and poor budget allocation in the following months.
What to pay attention to when implementing category changes?
When implementing category changes, it is important to ensure the actions align with the main growth driver of that category. If the problem is low traffic, priorities will be visibility, category structure, and exposure. If the problem is poor conversion, the offer, filtering, product presentation, and trust elements will be more important.
The first practical step is to establish a starting point and success metrics. Before implementation, it’s worth recording current traffic, CTR, conversion rate, revenue, margin, category sales share, and availability level. Without a solid comparative baseline, you cannot assess whether the change actually improved the result.
Many problems arise at the intersection of SEO, UX, and product data. A category may have good demand, but won’t exploit it if the page is not properly indexed, filters create chaos, and product names and attributes do not match actual user queries. Therefore, during implementation you need to check URLs, meta data, category content, filtering logic, product feed, and completeness of data in the system simultaneously.
It’s also important to make sure you don’t increase exposure faster than the store can handle the growth. A campaign, improving organic rankings, or stronger category highlighting in the menu can quickly raise demand, but without stable stock and reasonable delivery times, the effect will be short-lived. Make sure the category has stock to sell first, then increase traffic.
For bigger changes, it’s best to implement them in stages. First, improve structure and data; then launch activities that support traffic; and finally, optimise conversion based on user behaviour. This sequence reduces the risk of fixing the wrong element or masking one issue with another.
At the end, post-implementation monitoring is necessary, preferably with notes on what exactly was changed and when. You need to observe not only sales but also visibility, CTR, conversion rate, number of active products, returns, and margin. Good implementation is not a one-off fix but a controlled process with clear measurement of results.
How to monitor the effects of implemented actions in product categories?
The effects of implemented actions in product categories are best checked calmly. So, compare changes in traffic, visibility, CTR, conversion, revenue, margin, and availability before and after implementation, point by point. Sales growth alone is not enough, as it could equally result from promotions, seasonality, or simply a bigger advertising budget. Good monitoring shows whether the change really improved the category’s result, not just coincided with another factor. Therefore, conduct analysis at the specific category level, not the entire store, because the true causes are lost at the “overall” scale.
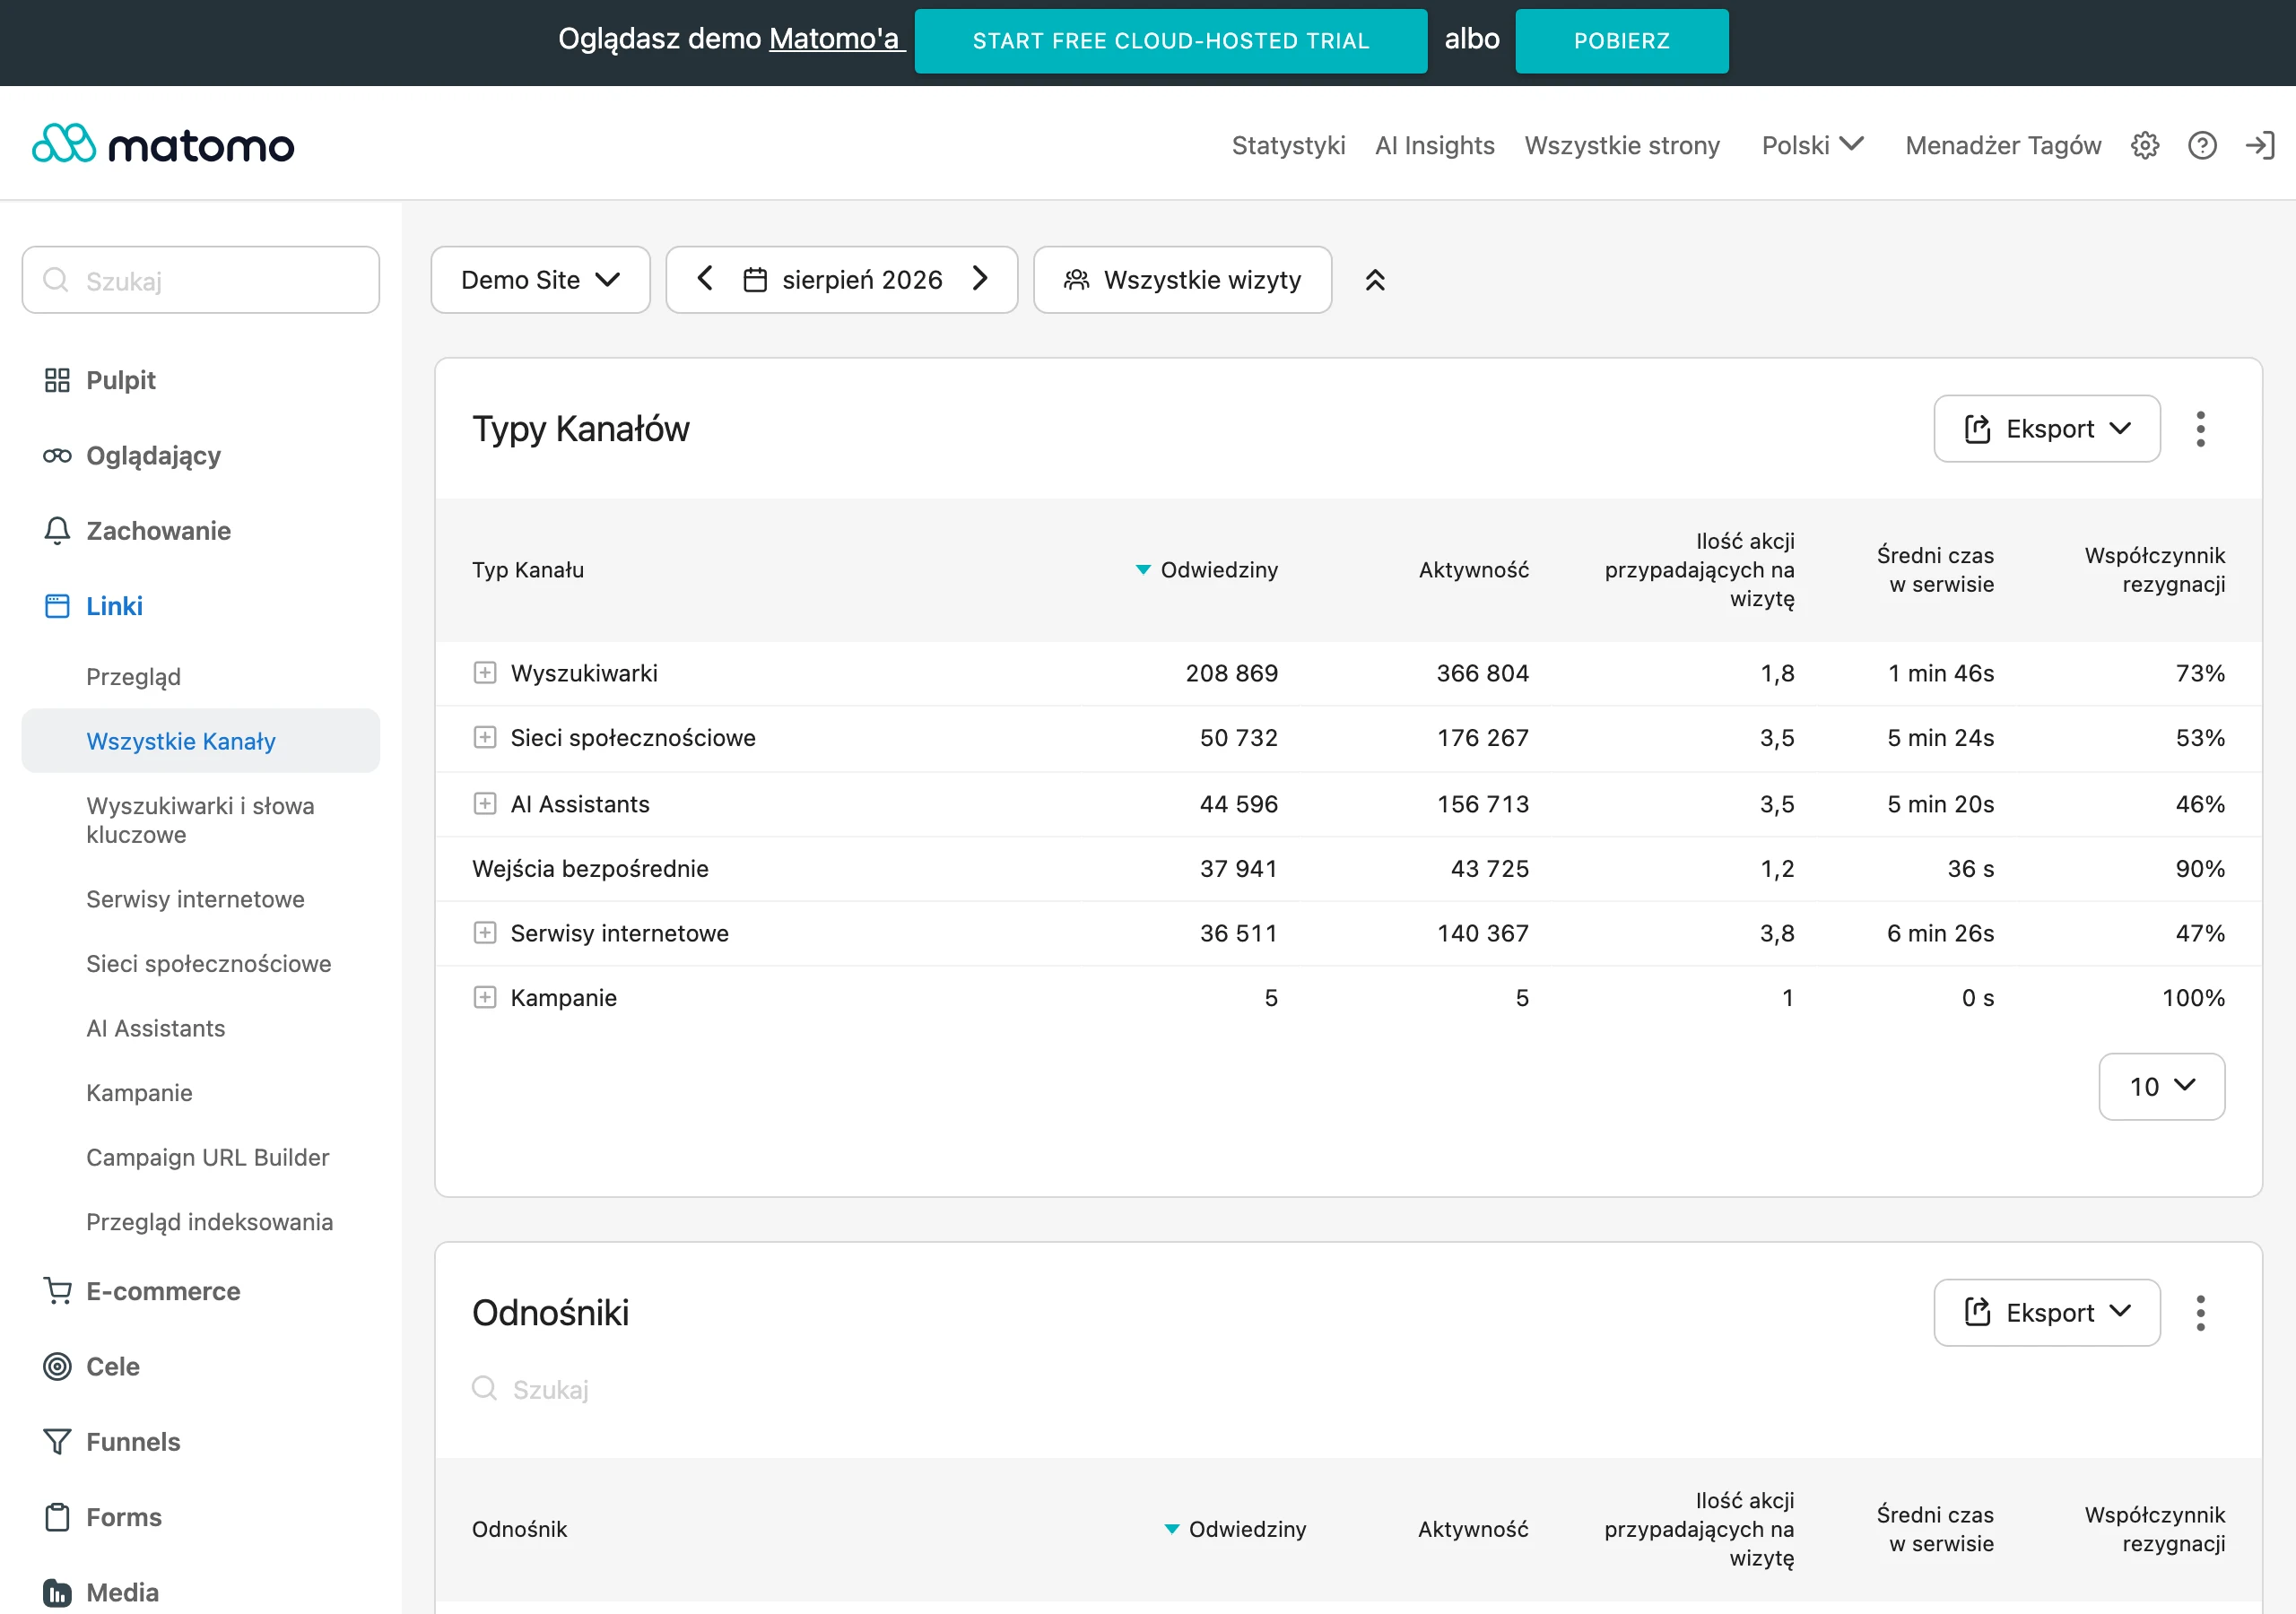
The first step is simple. Set a reference point and record exactly what was changed, without assumptions. You need the implementation date, scope of changes, and previous results from a comparable period so you don’t compare apples to oranges. If you improve category content, filters, feed, menu exposure, or product campaigns, each of these changes should have its trace in analytics and internal change logs. Without implementation history, it’s very easy to attribute an effect to the wrong action.
Metrics are chosen based on the objective, not team habits. Different actions affect different stages of the result, so measuring everything at once usually clouds the picture. For SEO, impressions, rankings, CTR and organic traffic are more important, as this is where the battle for clicks takes place. For changes in the offer or UX, conversion, basket value, number of transactions and stock availability are more relevant, as this is where customers are lost. When assessing profitability, margin, returns and traffic acquisition cost come into play, i.e. the hard „how much stays in the till”.
- category visibility for branded and non-branded keywords,
- number of impressions and CTR in search results,
- traffic to the category broken down by channel and device,
- conversion rate, order count and average basket value,
- revenue and margin at the category level,
- number of active SKUs, availability and delivery time,
- return rate and share of unavailable products.
Interpretation of results must take into account the type of change and the time needed for the effect. SEO is usually not evaluated after just a few days, whereas UX or exposure changes can impact conversion much faster. The question is: what exactly do you expect and within what timeframe. If you are expanding your assortment, it makes more sense to first observe demand coverage, availability and clicks in product lists, and only then hard sales, because sales is the consequence here, not the starting point. For paid campaigns, you must separate growth resulting from a better category structure from growth „delivered” simply by budget.
It is crucial to distinguish lasting improvement from seasonality or promotion. Compare results not only to previous weeks but also year on year, if the category has clear seasonality, otherwise it is easy to confuse a trend with the calendar. A good practice is to compare the category after the change with a similar control category where nothing was implemented, instead of guessing based on a single chart. If only one category grows following a specific change, the conclusion is stronger than when the whole market grows.
In monitoring, strictly separate data by traffic source, device and user type. This makes a difference, because the same category can raise results on mobile but suppress them on desktop. It may also capture more entrances from SEO, while at the same time sacrificing profitability if the share of low-margin products grows. The question is where the change really works, and where it just looks good on average. Such segmentation mercilessly shows what is delivering results and what requires adjustment.
In practice, a simple rhythm wins. Weekly operational monitoring and monthly decision-making assessment organise chaos instead of multiplying it with more tables. Weekly you catch warning signals: decline in availability, CTR, conversion or feed quality. Monthly you decide whether to scale the category, leave it unchanged, or improve additional elements from the offer to exposure. The goal of monitoring is not reporting for the sake of reporting, but a quick decision: what to increase, what to stop and what to fix.
FAQ
Frequently asked questions
How is the growth potential of a product category assessed in practice?
Demand, sales, visibility, margin, and operational constraints are compared, then priorities are assigned to actions. Organising data is also important to fairly compare categories using the same criteria.
Does high sales mean a category has the greatest growth potential?
No, because the category might be close to its ceiling or operating on too low a margin. Potential rather reflects the gap between current performance and realistic improvement possibilities.
Why might poor search engine visibility indicate high category potential?
Because there may be high demand with low exposure, so the store doesn’t fully exploit market interest. In such cases, growth can come from improving SEO, category structure, and filters.
When does a category have growth potential but is not suitable for scaling?
When it has low margin, few products, high returns, or unstable inventory. Then increased traffic doesn’t necessarily translate into better business results.
What most often blocks category growth despite high demand?
Usually problems with exposure, conversion, or data quality, such as poor filtering, incomplete attributes, poorly constructed URLs, or sparse descriptions. These are barriers that limit demand utilisation.
What are the most common mistakes in assessing category potential?
The most common is looking only at revenue, ignoring margin, availability, and returns. Another error is confusing seasonal spikes with lasting trends and mixing brand and non-brand data in a single result.