
configuration and verification of Google Search Console: key steps
Configuration and verification of Google Search Console starts with choosing the right property type: “Domain” or “URL prefix”. A “Domain” property covers all protocols and subdomains (http/https, www/non-www), which reduces the risk of analysing incomplete data when the site exists in several variants. A “URL prefix” applies only to a specific address and can be useful if you want to examine only part of the site, e.g. the /blog/ directory. If you have http/https as well as www and non-www versions in parallel, the “Domain” type usually organises the analysis better.
The safest way to verify ownership is via DNS (TXT record), as it is the most durable and is especially recommended for the “Domain” type. Methods using an HTML file or meta tag are quick, but they are easy to remove accidentally when changing the theme or deploying a new template. Integration via Google Analytics or Tag Manager works only if you have the correct permissions and the tag is properly embedded on the site. In practice, the choice of method should primarily reduce the risk of losing verification during technical changes.
Permissions in GSC are assigned through roles: Owner, Full and Restricted, which makes safe client–agency collaboration easier. The Owner can manage verification and users, “Full” has access to the data and can perform actions such as submitting a sitemap, while “Restricted” has view-only access. This makes it easier to avoid a situation where an employee leaving the company causes problems with access or property ownership. The most common practice is to leave the Owner role on the client side and grant the contractor “Full” access for the duration of the project.
After a migration (e.g. from http to https or to a new domain), add the new property in GSC and keep the old one so you have visibility of redirects and potential drops. You then compare the Performance report between properties, checking whether queries and pages are “moving” to the new version. If you still see indexing of the old variant, the usual culprits are inconsistent 301 redirects or a canonical pointing to the wrong address. It is also worth remembering that GSC no longer has the “preferred domain” switch, and canonicalisation is determined by signals such as redirects, rel=canonical, internal linking and sitemap.
GSC also offers settings that make quicker responses and more sensible data linking easier: email notifications and integration with GA4. Enabling emails helps you quickly spot issues (e.g. an increase in 404s or a problem with the sitemap), and with multiple properties a mail filter for the phrase “Search Console” comes in handy. Once connected with GA4, you can analyse query and landing page data from organic Google in GA4, combining “visibility” with “behaviour” (e.g. conversion), with the caveat that clicks in GSC and sessions in GA4 do not mean the same thing. If you plan year-on-year analyses, take retention into account as well: the Performance report stores historical data for around 16 months, so for a longer horizon you need regular exports (e.g. to a spreadsheet or BigQuery).
- 01Property typeDomain or URL Prefix (Choose according to your needs).
- 02DomainAll Protocols and Subdomains (Complete data).
- 03URL PrefixSpecific Address (For a section of the site).
- 04DNS verificationTXT method (Permanent and Secure).
The key takeaway is choosing the right property type and permanent verification via DNS.
data analysis in Google Search Console: metrics and reports
Data analysis in Google Search Console comes down to understanding metrics and reading reports carefully in the context of queries, pages and changes over time. A click means a visit from an organic Google result, and an impression means your result appeared in the SERP. CTR is the ratio of clicks to impressions and can fall even when clicks increase if impressions grow faster (e.g. you start appearing for a larger number of queries). Average position is averaged across many queries and locations, so it is better treated as a trend indicator rather than a “hard” position for a single keyword.
Data from GSC may differ from rank-tracking tools because it shows real user searches rather than a simulated SERP for selected keywords. For this reason, in GSC you will see queries you do not monitor in a tracker (e.g. long tail), and the positions themselves may differ due to personalisation and location. In practice, GSC best supports conclusions about traffic (clicks/impressions), while a rank tracker is used to control specific keywords over time. If you want to diagnose business impact, start with GSC, because it is based on data from actual searches.
The most value comes from segmentation and cross-tabulating dimensions: queries, pages, countries, devices and search type (Web/Images/Videos). This makes it quick to verify whether a CTR drop affects mobile only, or whether the issue is limited to one country. Period comparisons (e.g. the last 28 days vs the previous 28 days, or year-on-year) make it easier to distinguish seasonality from a technical problem: a drop in clicks together with a drop in impressions often points to lost visibility or an indexing issue, whereas a drop in CTR with stable impressions suggests a problem with snippets or increased competition. Comparing periods is the quickest way to determine whether the problem affects visibility (impressions) or the attractiveness of the result (CTR).
GSC does not offer “URL groups” directly, but you can filter by prefix (e.g. /blog/ or /category/) to assess the performance of a given section and catch template issues. For more detailed analyses, use regex filters, e.g. to separate brand vs non-brand or to identify informational queries (“how|what is|guide”). It is worth remembering that the total in the table is not always equal to the total after filters, because GSC may apply aggregation depending on the date range and number of rows. If you need the highest accuracy, export the data and analyse it on raw rows (e.g. via the API).
Data exports (CSV, Google Sheets) make it easier to calculate shares and build summaries, while dashboards in Looker Studio (Search Console connector) speed up diagnosis in team work. When interpreting sudden changes, also take Google updates into account: if, on the same day, declines affect many page types and queries while indexing remains stable, an algorithm update may be the cause. In such a case, compare which content clusters have lost out and whether impressions have dropped (loss of rankings) or CTR (changes in the SERP appearance). Also check whether new SERP elements have appeared (e.g. FAQ, maps, AI Overviews), which may be “eating” clicks.
visibility and CTR optimisation: performance strategies
Visibility and CTR optimisation in Google Search Console comes down to drawing conclusions from the Performance report and translating them into concrete changes in content and in the way the result is presented in the SERP. In practice, you start with query analysis, because that is where you can see real phrases (including unplanned ones), as well as differences in intent, long tail and potential content gaps. If a given page appears for “price + product” queries in positions 11–15, it is often helped by expanding the pricing section and FAQ, and by matching H2/H3 headings to user intent. Similar conclusions are worth forming at the topic cluster level so you can point to areas that need refining, rather than only individual URLs.
The easiest “quick wins” are identified by filtering queries and pages with an average position of 8–20. In this range, even a small adjustment to content or internal linking can have a noticeable effect on clicks, especially for informational content. In practice, you “push” such URLs by expanding key sections, refreshing information (e.g. comparisons) and adding links from strong subpages. If you have limited time, prioritise positions 8–20, because that is usually the fastest route to more clicks without waiting months.
The safest way to increase CTR is to test titles and meta descriptions on page groups rather than on individual URLs. A practical approach is to roll out one format across a larger batch of URLs (e.g. informational articles) and assess the CTR change over a 14–28 day horizon, taking seasonality into account by comparing periods. If CTR rises but clicks do not, it usually means the bottleneck is impressions and positions, not the snippet itself. Also check whether the changes coincide with modifications to the SERP appearance, because new elements can “eat” part of the clicks.
In the Performance report, you can also spot keyword cannibalisation when the same query generates impressions for multiple pages and none takes the dominant role. The diagnosis involves opening the query and checking the “Pages” tab, and corrective actions include content consolidation, a 301 redirect, strengthening the canonical, or separating intent (e.g. guide vs offer). If you are implementing structured data (where permitted), compare CTR changes with Enhancement reports (Rich Results), because a richer snippet often boosts clickability. On multilingual sites, additionally filter by countries and languages to ensure the correct URL versions are displaying and that there is no language mixing caused by hreflang, sitemap or canonical errors.
- 01Query analysisDiscover real phrases and gaps
- 02Content expansionMatch H2/H3, add sections
- 03Quick winsFilter average positions
Key to success: translate insights from reports into concrete changes in content and presentation.
technical diagnosis: indexing and page status in GSC
Technical diagnosis of indexing in Google Search Console comes down to reading the statuses in the Pages report (Pages/Indexing) and determining whether the problem concerns discovery, crawling, or content quality. The status “Discovered — currently not indexed” often points to gaps in internal linking or crawl budget limitations, because Google knows the URL but has not yet fetched it. “Crawled — currently not indexed” means the content has been fetched, and the cause may be duplication, low quality or a soft 404. This distinction makes it easier to decide whether you should first strengthen accessibility and architecture, or whether you should prioritise refining the content.
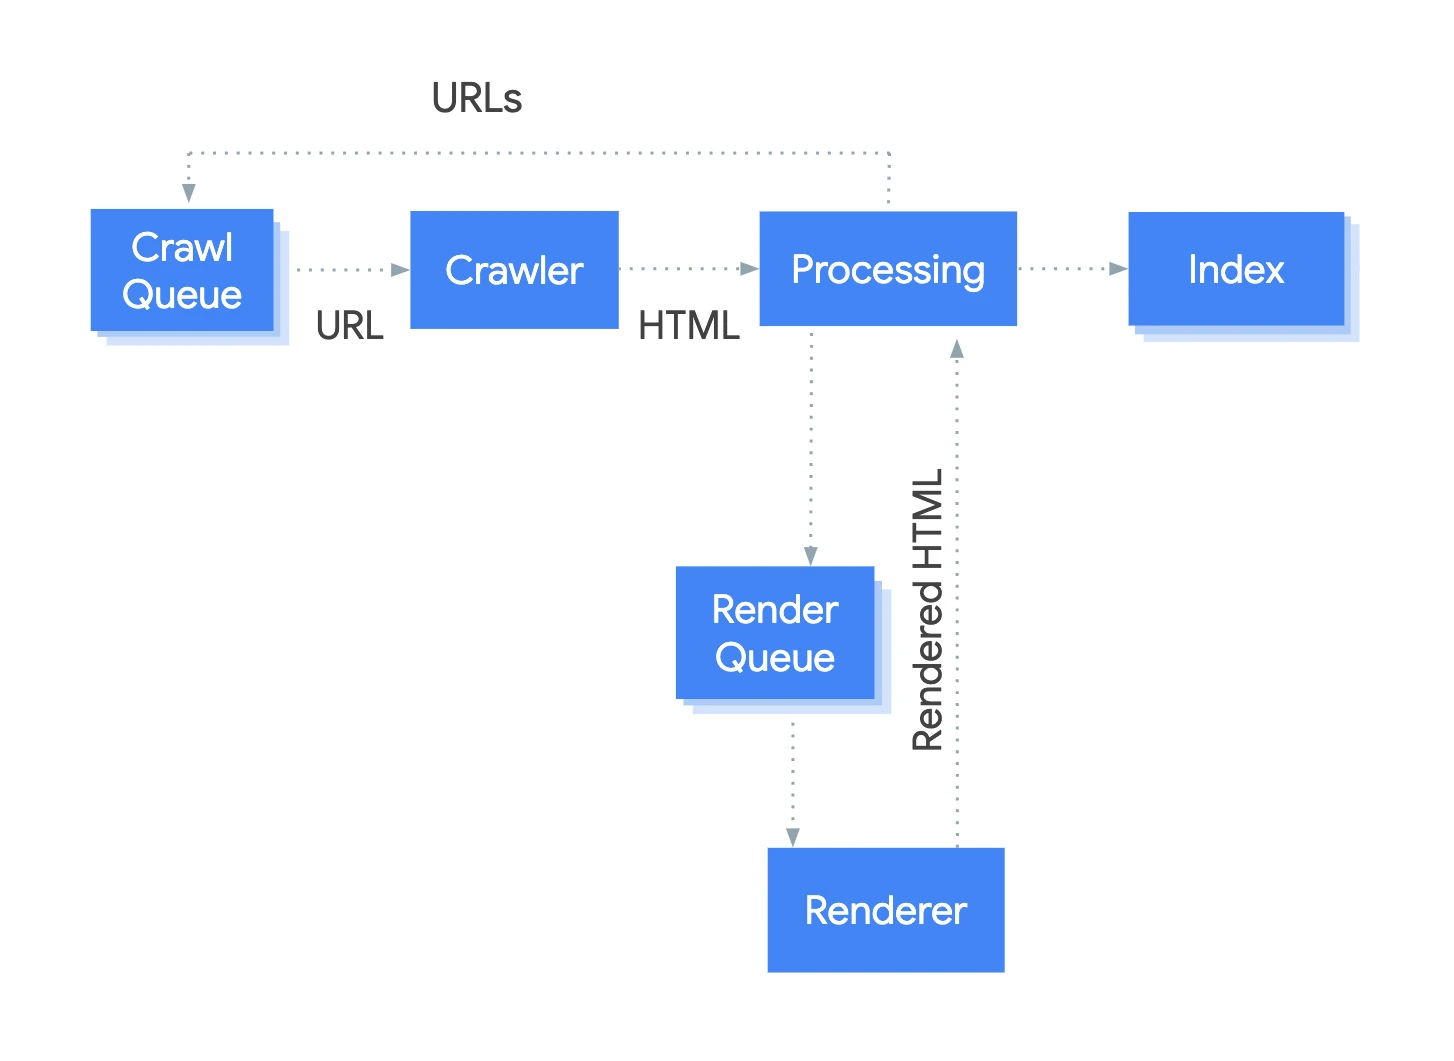
The most common reasons for the “Excluded” status include “Page with redirect”, “Duplicate, user did not choose canonical”, “Alternate page with proper canonical tag” and “Blocked by robots.txt”. Fixing this usually comes down to standardising URL variants (https, trailing slash, parameters) and tidying up signals: redirects, rel=canonical, linking and the sitemap. In e-commerce, it is especially important to watch out for soft 404s, because pages returning code 200 and a message such as “No products” can reduce the indexing of similar URLs across the whole catalogue. If a section is empty, in practice it needs either meaningful content and alternatives, or logic that returns 404/410.
Server errors (5xx) are critical, because widespread 500/503 responses can limit crawl and slow down index refreshes. Regardless of GSC, it is a good idea to monitor server logs and availability alerts, because in a crisis the key is a quick reaction to a hosting or application problem. Redirects are a separate category: a single URL shown as a “Page with redirect” is usually nothing unusual, but A→B→C chains slow crawl and dilute signals. Aim for a single 301 hop to the destination version, especially after migrations, so Google updates the index faster and more clearly.
When a page refuses to be indexed, check not only meta robots and robots.txt, but also the X-Robots-Tag HTTP header, because it can override the intent (e.g. “index” in HTML with “noindex” in the header). Duplicate content and crawl budget waste are often driven by parameters (sorting, filters, UTM), so control should be on the site side: canonical to the primary version, crawl blocking for irrelevant parameters, and linking only to canonical URLs. The URL Inspection tool and “Request indexing” make sense for individual important pages or for quick verification after fixes, but they do not replace the sitemap or internal linking. If after a request the status returns to “Crawled — currently not indexed”, that is a sign the barrier is quality or duplication, not discovery.
sitemaps and information architecture: ensuring efficient crawling
You achieve efficient crawling by Google when the sitemap and information architecture lead bots to canonical URLs that are easy to reach via internal linking. A single XML sitemap can contain up to 50 000 URLs and be 50 MB in size (uncompressed), so large sites split sitemaps into several files and use a sitemap index. Add only canonical URLs returning status code 200 and intended for indexing to the sitemap, because “junk” in a sitemap weakens the signal quality. In e-commerce, separate files are often used, e.g. for products, categories and the blog.
- Keep only canonical URLs with status code 200 and no indexing blocks in the sitemap.
- For a large number of URLs, split sitemaps into files and use a sitemap index.
- Check in GSC whether the file was fetched and how many URLs Google read.
- Do not assume the sitemap alone will automatically “force” indexing. If the proportion in the index is low, look for the source of the problem in content quality, duplication or blocks.
Monitoring sitemaps in GSC comes down to checking whether the file was fetched and how many URLs Google actually read, which quickly exposes syntax errors or resource unavailability. If “Discovered URLs” significantly exceeds “Submitted”, it may mean the sitemap contains references to other sitemaps or that Google is finding URLs through other channels, for example via linking. When a sitemap returns 404/403 errors, check firewall/CDN rules (e.g. Cloudflare) and cache headers. In practice, a sitemap helps speed up discovery and recrawling, but it does not guarantee indexing.
You also set crawl control through robots.txt, but it is worth doing so carefully, because this is a crawl management mechanism, not a way to hide content from the index. A URL can enter the index without content (“URL-only”) if you merely block its fetching. Do not block resources needed for rendering (CSS/JS), because that makes it harder to assess the page. If the goal is removal from the index, the proper route is noindex or removing the page (404/410), not disallow alone.
Information architecture is strengthened above all by internal linking, because for Google it is a “priority map” and the foundation of discovering subpages. Orphan pages may be “discovered” in the sitemap, but they will be crawled sporadically if there are no sensible links to them from the site. Subpages hidden at the 5th–6th navigation level are usually visited less often, which shows up as delays and “discovered” statuses, so shortening paths, for example through hubs and breadcrumbs, improves crawl. Tools such as Screaming Frog SEO Spider or Sitebulb are useful for auditing internal linking.
Category lists and paginations require particular attention, because they easily create duplication risks and can “lose” bots if infinite scroll is implemented incorrectly. Infinite scroll without proper pagination in the URL can mean Google does not reach further items in the list, even though users can see them, which in GSC appears as poor indexing of deep products and fewer long-tail impressions. A safe approach is server-side pagination with unique URLs (e.g. /category?page=2) and links that the bot can follow. For sort orders and parameters, usually set the canonical to the default version, and if a sort order matches a different intent (e.g. “cheapest…”), consider a separate landing page instead of a parameter.
The monthly crawl and indexing audit ritual is one of the fastest ways to catch issues before they affect traffic. Once a month, compare the Pages report (errors and exclusions), the Sitemaps report (errors) and the list of new URLs (e.g. from the CMS), then check their status in URL Inspection. On large sites, add server log analysis (e.g. via Splunk/ELK) to see what Googlebot is actually crawling. This cycle helps you spot regressions early after changes, for example a sudden spike in 404s after modifying permalinks.
- 01Directing robotsCanonical tags and internal links
- 02Managing scaleSitemap index splitting
- 03Data cleanlinessOnly indexable 200 URLs
- 04Verification in GSCFetch vs. URL render
Efficient crawling means precisely guiding Google robots through an optimised architecture and clean sitemap data.
improvements and UX: Core Web Vitals and rich results
You refine improvements and UX in GSC when you turn insights from the Core Web Vitals and rich results reports into concrete changes in the template and structured data. The CWV report groups URLs by issues with LCP, INP and CLS, based on data from the Chrome UX Report (CrUX), that is, from real users rather than laboratory tests. If the “Poor” status covers many addresses, the source of the problem is most often the template (e.g. a hero image or scripts), not an individual subpage. GSC provides example URLs, while fixes are implemented at the front-end component level.
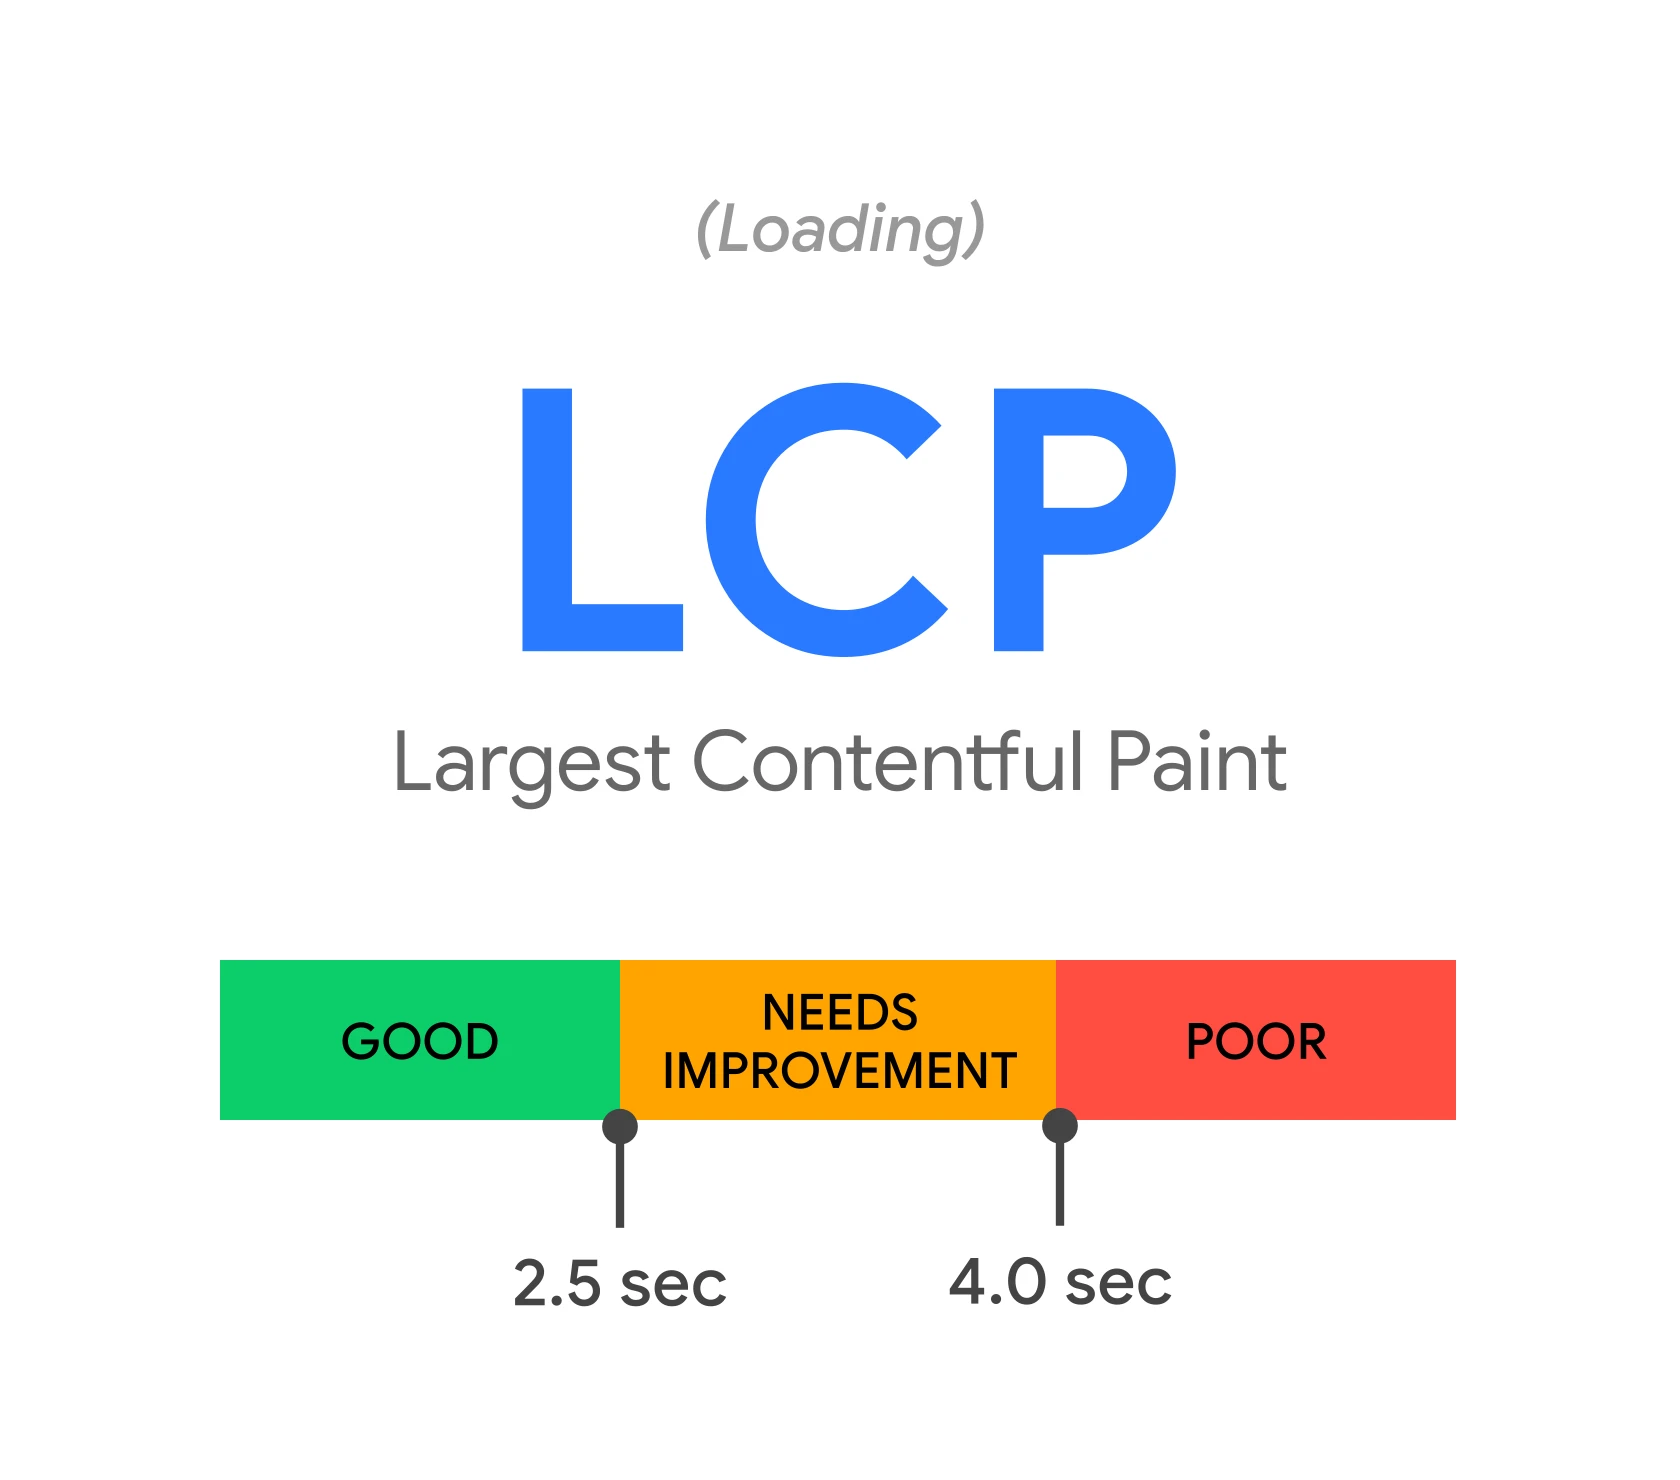
You will improve LCP fastest when you focus on the largest resources and response time, because high LCP is often the result of large hero images, no preloading and slow TTFB. In practice, this means compressing images (WebP/AVIF), setting width/height, preloading the key image and caching via a CDN (e.g. Cloudflare). After deployment, verify the result in PageSpeed Insights and watch whether LCP drops below ~2.5 s for most users. This approach lets you separate the “heavy view” problem from strictly server-side issues.
You will lower INP (previously FID) when you slim down JavaScript and limit demanding third-party scripts, because high INP is often the result of long tasks and too much third-party code (chats, heatmaps, ad tags). In practice, this means a smaller bundle, delaying non-critical scripts and reducing tags in Google Tag Manager. After the changes, monitor results in Lighthouse and field data (CrUX), remembering that GSC updates with a delay. This stops you drawing premature conclusions such as “nothing has changed” when the data simply has not refreshed yet.
You will reduce CLS when you stop the layout from “jumping” by reserving space for dynamic elements, because CLS is hurt by things such as images without dimensions, cookie banners, ads and fonts without font-display. The simplest step is to set height/width or placeholders and avoid injecting elements above the content after render. In e-commerce, a common culprit is the “related products” module, which appears only after loading. At the same time, analyse the mobile reports, which can point to issues such as “tap targets too close together” or “content wider than the screen”.
You develop rich results when you implement structured data and monitor it in the Enhancements reports in GSC. GSC provides reports for types such as Product, Breadcrumb, Organization, Article and Video, and “missing field” errors may mean you are not eligible for a rich result. For Product, you usually need price, availability and currency, among other things, so verify the implementation in the Rich Results Test first, and only then use “Validate fix” in GSC. First, complete the required fields in structured data, because without them even the “test in GSC” will not translate into a valid rich result.
Consider the fix validation process closed only when the reports and validations are no longer sending conflicting signals. After clicking “Validate fix”, GSC starts validation, but this does not translate into immediate changes in rankings or CWV, and in the case of field data (CrUX) you need to take a weeks-long perspective into account. You close the issue when the error disappears from the report, URL Inspection shows no conflicts, and logs and monitoring confirm there has been no regression. This approach reduces the risk of the problem returning after the next deployment.
security, links and automation in Google Search Console
You control security, links and automation in Google Search Console mainly through the Manual actions, Security issues and Links sections, as well as through ongoing monitoring based on data and alerts. Manual actions require a “step by step” approach: first you establish the cause (e.g. unnatural links, comment spam, cloaking), then you remove or neutralise the source of the problem, and finally you submit a reconsideration request with documented evidence. Without clear documentation of the actions taken, a reconsideration request is often rejected, so it is worth managing the remediation plan like a project.
Treat security issues in GSC as a critical incident, because warnings about malware or phishing can trigger alerts in Chrome and a sharp drop in traffic. A practical workflow includes isolating the problem (e.g. a Wordfence scan for WordPress), changing passwords and updating plugins, and then cleaning the files and database. Once the threat has been removed, you submit a request in GSC for review to clear the warnings. As a result, GSC serves not only as an SEO report, but also as a channel for quickly detecting operational risks.
The “Links” report in GSC is used for control and diagnostics, but it is not a full link index like Ahrefs or Majestic. It is worth using it to check whether mass spam aimed at a single URL has appeared or whether important sections of the site are actually acquiring links. If you see a sudden surge of links from unusual TLDs, also check whether a manual action has occurred or whether there are security issues. Consider disavow cautiously and preferably only when you have a real problem with unnatural links (especially one confirmed by a manual action), because cutting off signals too aggressively can reduce domain authority.
You can base automation in GSC on the Search Console API and data integration in external analytics tools. The API makes it possible to pull clicks, impressions, CTR and positions into your own systems, for example as part of a daily import into BigQuery and a Looker Studio dashboard with a history longer than the standard report view. In BigQuery, you can also combine API data with GA4, campaign costs and CRM to answer business questions (e.g. which queries have the highest margin) and build tables such as queries_daily, pages_daily and URL→category mapping. To make alerts meaningful, set thresholds on critical metrics (e.g. a 500% day-on-day increase in 404s, a 30% WoW drop in clicks on the top 20 pages, 5xx above 1% of requests), instead of “notifications for everything”.
You use removals when you need a quick, temporary hiding of a URL (usually for about 6 months), for example after a data leak or accidental indexing of private pages. This tool does not resolve the issue permanently, so in parallel you implement noindex, remove the page (404/410) or secure access (e.g. with a password/401). A common case is mistakenly indexed /test/ pages: first you hide them through Removals, and then you tidy up robots/noindex and redirects. This approach shortens the time the error is exposed and limits the risk that the problem will return with the next deployment.
planning actions based on GSC data: prioritisation and strategies
Planning actions based on GSC data comes down to building a task backlog according to impact and assigning measurable goals to it, so that SEO work is judged by results rather than reporting alone. Prioritise where the potential is greatest: many impressions with a low CTR, positions with a real chance to “move up”, and pages losing visibility year on year. Describe each backlog item with a target metric, e.g. “+20% clicks for /category/ in 30 days” or “CTR from 2.1% to 3.0% for 10 non-brand keywords”. That way, GSC becomes a tool for decision-making and accountable outcomes, not just a screen of data.
- At the start, choose tasks with the biggest impact: a high number of impressions + low CTR, and pages/sections with large volume.
- Add “quick wins” resulting from rankings: queries and pages with potential for improvement in the short term.
- Supplement the backlog with risk areas: pages losing impressions year on year and sections where there are signs of indexing issues.
- For each task, add a goal in GSC metrics (clicks, CTR, impressions) and a deadline, so that the effect after implementation is easy to assess.
When traffic drops, first separate the cause into a drop in impressions (visibility/indexing) or a drop in CTR (snippets/SERP), and only then move on to deeper diagnostics. Next, review the Pages report for an increase in exclusions, the Core Web Vitals report for template regressions, and manual actions and security messages. Only in the next step do you analyse query and page clusters to identify the specific source of the problem (e.g. a change to titles across the site vs a noindex error after deployment). This playbook shortens the path from “I see a drop” to “I know what to fix” and reduces the risk of acting blindly.
In a mature planning process, it is worth connecting GSC with automation and data modelling to detect anomalies faster and maintain a consistent business context. A daily import of data from the Search Console API into BigQuery and a Looker Studio dashboard make it possible to keep history and build comparisons that cannot be recreated without archiving. This approach also makes it easier to set alerts and thresholds (e.g. week-on-week drops in clicks for a key section) and to combine SEO data with GA4, costs and CRM. In practice, this means priorities are driven not only by visibility, but also by impact on business performance, which can be confirmed on shared data.
FAQ
Frequently asked questions
How do you choose a property type in Google Search Console: Domain or URL Prefix?
The “Domain” property covers all protocols and subdomains, so it usually works better for sites operating in several variants. “URL Prefix” is useful when you want to analyse only a specific section of the website, e.g. /blog/.
Why is verification of ownership via a DNS record the safest option?
DNS verification via a TXT record is the most durable and is especially recommended for the “Domain” property type. Methods based on an HTML file or meta tag are quick, but they are easier to remove accidentally during technical changes.
What permissions can be granted in Google Search Console and how do they differ?
In GSC there are roles: Owner, Full and Restricted. The Owner manages verification and users, “Full” has access to data and can perform actions, while “Restricted” has only view access.
Do you need to add a new property in GSC after a site migration?
Yes, after a migration it is worth adding a new property and keeping the old one so you can monitor redirects and any drops. Then you can compare the Performance report between properties and check whether queries and pages have moved to the new version.
What do the metrics clicks, impressions, CTR and average position mean in GSC?
A click means a visit from an organic Google result, while an impression means the result appearing in the SERP. CTR is the ratio of clicks to impressions, and average position is averaged across many queries and locations, so it is best treated as a trend indicator.
How can you tell in GSC whether a drop concerns visibility or CTR?
Compare periods, e.g. the last 28 days with the previous 28 days or year on year. A drop in clicks and impressions usually points to a loss of visibility or an indexing problem, while a drop in CTR with stable impressions suggests a snippet problem or stronger competition.