
How to determine the real position of a site in Google?
You will only establish the real position of a site in Google once you specify the query, country/location, device and moment of measurement. Position in Google is the place of your result in the SERP for a specific keyword (e.g. “women’s running shoes”), and results can differ by even several to a dozen positions depending on whether you check them in Warsaw or in another city, as well as on mobile or desktop. If you are asking “which position am I in?”, first always determine: the keyword, location, device and date of measurement. This reduces the risk of drawing incorrect conclusions and allows you to compare data “apples with apples”.
- Keyword (the user’s exact query)
- Location (country/city, e.g. PL/Warsaw)
- Device (mobile vs. desktop)
- Moment in time (day/week, because the SERP changes)
The most reliable verification comes from data analysis in Google Search Console, because the “Performance” report shows clicks, impressions, CTR and average position for queries and pages. However, it is worth remembering that the “average position” in GSC is an average of many impressions, so a result such as 12 often means a mix: once 5, another time 20, depending on the query, device and personalisation. If you want to narrow down the measurement, use filters for country, device and search type, and then assess change by comparing periods (e.g. the last 28 days vs. the previous 28 days). This approach better reflects the trend than manually “checking in Google”.
Manually checking positions in the browser is often the least reliable, because personalisation and geolocation can change the order of results. If you need to quickly verify the SERP manually, use incognito mode, set the “gl=PL” and “hl=pl” parameters, and ideally use a tool that simulates neutral results (e.g. Ahrefs SERP or Semrush SERP). When you notice discrepancies between “live” results and the data, bear in mind that the SERP contains elements (maps, ads, rich results) that can push classic links lower and thereby reduce CTR. Additionally, new content usually needs time to settle, and the first 7–30 days are the period of the greatest fluctuations, so it is better to look at the weekly or monthly trend than at day-to-day results.
- 01Specify the querySpecific keyword
- 02Define the locationCountry or city
- 03Choose the deviceMobile or desktop
- 04State the measurement dateMoment of data verification
- 05Analyse in GSCPerformance report
The key is precision: define the keyword, location, device and time of measurement for reliable data.
Why is visibility more important than a single position?
Visibility is more important than a single position, because it shows a fuller picture of how many queries and how high your site appears in the results. One keyword may temporarily drop or rise, whereas the trend in the number of keywords in TOP3/TOP10 and the total organic traffic better reflect the real effect of SEO activities. In practice, the question “am I growing in Google?” should be based on changes in groups of keywords and pages, rather than chasing one “position”. This approach is also more resistant to fluctuations resulting from Google tests and changes in the SERP layout.
The most useful set of KPI for assessing visibility includes clicks, impressions, CTR, average position and the number of keywords in TOP3/TOP10/TOP50. Instead of focusing on one keyword, set goals such as “+20% organic clicks QoQ” and “+X keywords in TOP10”, because this will show faster whether the actions are moving in the right direction. It is also worth remembering that the SERP is volatile: maps, video, “People Also Ask”, local results and products can influence how much traffic even a high position delivers. Therefore, when assessing “visibility”, always take CTR and clicks into account, and not only ranking.
Visibility makes business sense only when you take search intent and the impact on conversions from organic traffic into account. Not every keyword has the same value: informational queries often build impressions, while transactional keywords more often drive sales, so it is worth segmenting them by intent and measuring conversions. To assess traffic quality, use GA4, which answers the question of what users do from organic search (e.g. engagement and conversions), instead of focusing on “which position am I in”. In practice, compare over time landing pages that are growing in GSC with their conversions in GA4 to check whether the increase in visibility translates into results.
What tools should you use to monitor position and visibility?
To monitor rankings and visibility, it is best to combine Google Search Console (real queries and search metrics), GA4 (behaviour and conversions from organic traffic) and a rank tracker (regular monitoring of selected keywords). A rank tracker answers the question “what position am I in” on a daily or weekly basis, for a defined list of keywords, country and device. In practice, tools such as Senuto Monitoring, Semrush Position Tracking, Ahrefs Rank Tracker, AccuRanker, SE Ranking or Advanced Web Ranking help control the distribution of rankings (TOP3/TOP10/TOP50) and the visibility trend across weighted keyword sets. A rank tracker does not replace GSC, because it measures only selected keywords, while GSC shows real user queries and their clicks and impressions.
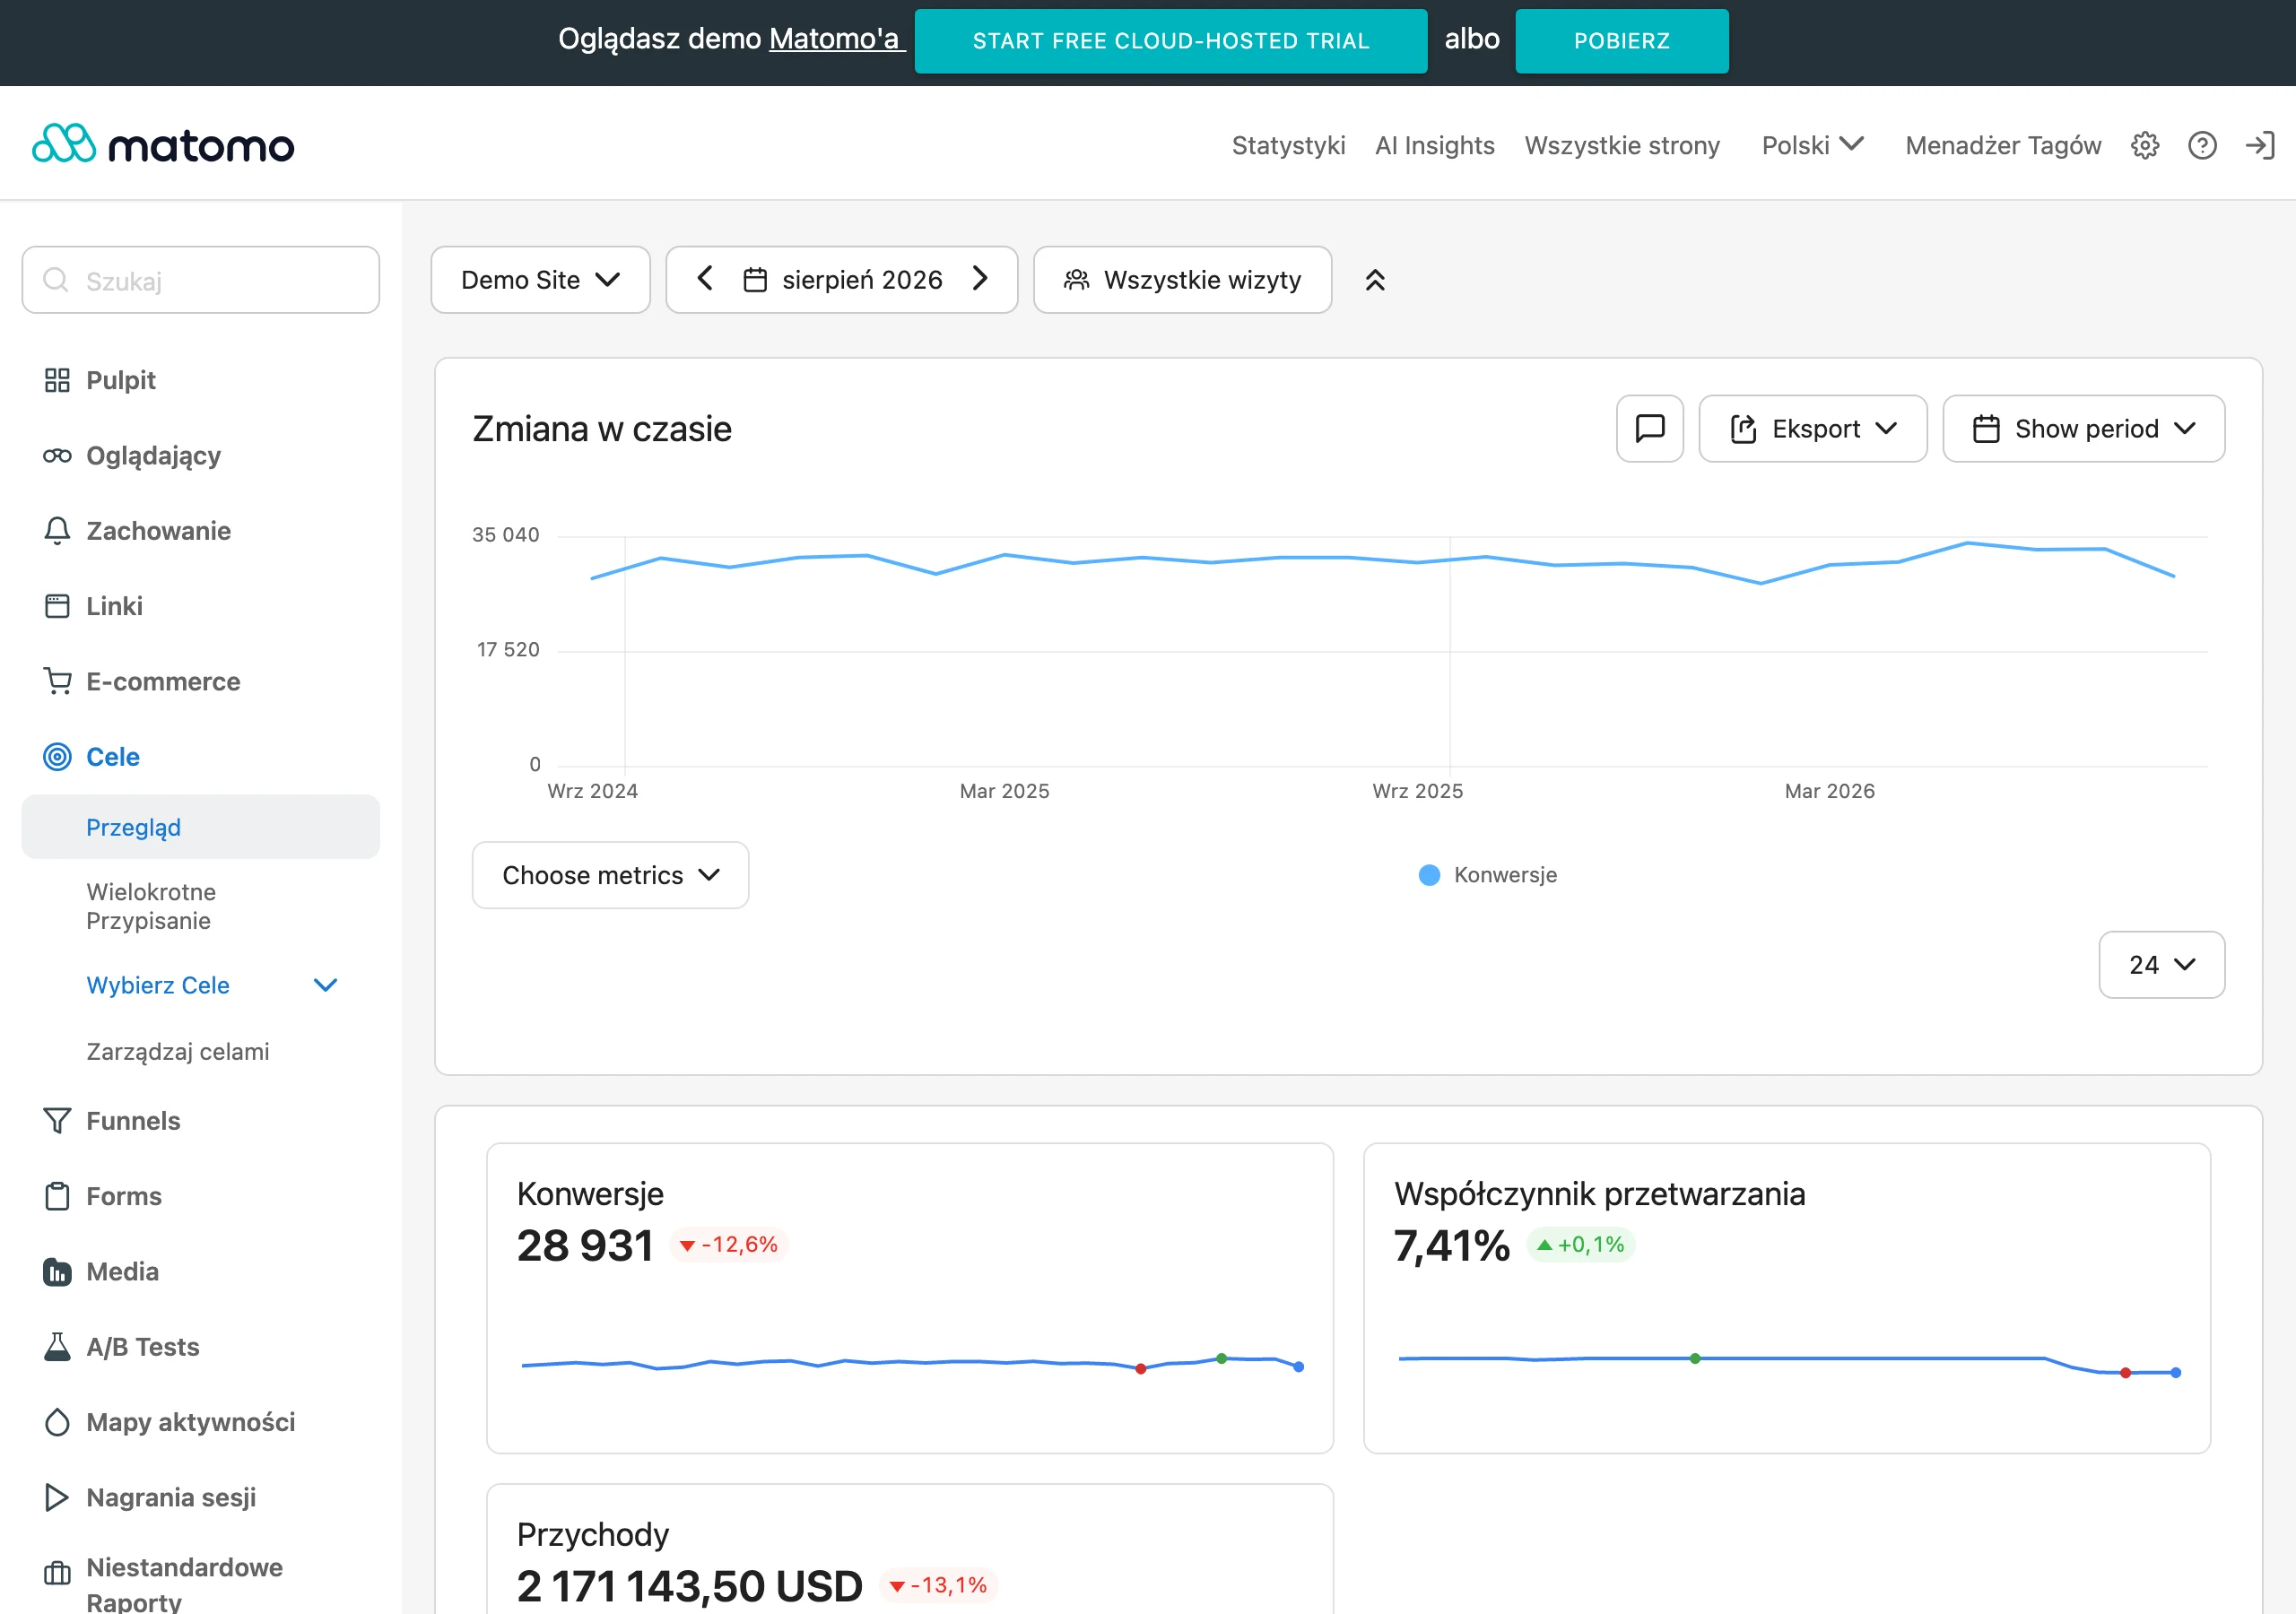
You will choose a ranking monitoring tool most accurately when you define the number of keywords and the refresh frequency (daily vs. weekly). If you plan to track 200–500 keywords, budget, update speed and the quality of visibility reports become key. AccuRanker is often associated with fast daily updates, while Semrush and Senuto are often chosen for the Polish market because of their database and reporting. Location and device settings also matter, because results can differ between cities and between mobile and desktop. For local businesses it is also worth considering grid ranking tools such as Local Falcon or Local Viking, which show map pack visibility in a grid of points across a city.
In rank trackers, it is worth observing not only the position itself, but also SERP features, because they can change CTR without a change in ranking. If clicks are falling despite a similar position, check whether a competitor has taken the featured snippet or whether an additional block has appeared in the results (e.g. a map pack or other SERP elements) that “pushes down” the classic links. For a reliable assessment of SEO performance, monitor branded and non-branded keywords separately, because a brand usually holds TOP1 even when there are issues. If you want to know whether SEO is really delivering growth, look first at the trend in non-branded keywords in TOP10 and their impact on traffic and conversions.
- 01Real data (GSC & GA4)Queries, clicks, conversions.
- 02Ranking monitoringSelected keywords, trends.
- 03Scope and purposeSelected keywords (RT) vs. all queries (GSC).
The best results come from combining real data (GSC) with monitoring selected keywords (rank tracker).
How to use Google Search Console effectively?
Effective use of Google Search Console means analysing the “Performance” report with the right filters and by comparing periods, rather than staring at individual days. The report shows clicks, impressions, CTR and average position for both queries and pages, making it easier to pinpoint the sources of gains and declines. To check which keywords you are appearing for, go to Performance → Queries and set a date range, e.g. the last 28 days, compared with the previous 28 days. Country, device and search type filters (Web/Image/Video/News) let you separate data into segments that genuinely differ in performance.
- Go to “Performance” and set the date range (e.g. 28 days) and comparison with the previous period.
- Add filters: country and Device → Mobile or Desktop, and, if needed, also search type.
- Go to the “Pages” tab, select a specific URL and only then check the “Queries” for which that subpage ranks.
- Assess changes holistically: clicks, impressions, CTR and average position, rather than drawing conclusions from a single metric.
When diagnosing visibility problems in Google, first use the Indexing section, because it clearly shows which URLs are in the index, which have been excluded and for what reason. The “Status” report in Page Indexing presents, among other things, the number of indexed addresses and exclusions such as “Crawled – currently not indexed”, which lets you quickly assess whether the issue concerns the scale of indexing. URL Inspection lets you verify an individual page: check the status “Page is on Google”, the “Last crawl” date and, if changes have been made, use the “Request indexing” option. If your key subpage does not appear in Google, URL Inspection is the fastest way to check how Google interprets it and whether it is in the index.
GSC is also useful for checking whether Google discovers new content efficiently and how SERP result elements are displayed. Sitemaps make it easier to find new URLs, although they do not guarantee indexing, so in GSC it is worth tracking the ratio: number of submitted vs. indexed addresses. The “Links” report helps assess which subpages have the strongest internal linking and external links, which often matters when an important category is standing still despite optimisation. In the “Enhancements” report (e.g. FAQ, Product, Breadcrumb), you can check structured data errors affecting how the site appears in SERPs, and for more advanced needs the GSC API lets you automate data retrieval and build your own dashboards (e.g. in Looker Studio or BigQuery).
How to analyse organic traffic in Google Analytics 4?
Organic traffic in Google Analytics 4 is analysed by filtering reports by the Organic Search channel and checking what users do on the site and what conversions they generate. GA4 answers mainly questions about behaviour (sessions, engagement, conversions), not about a specific position in Google, so treat it as a complement to data from Search Console. Go to Reports → Acquisition → Traffic acquisition and set “Default channel group = Organic Search” to see how the quality and effectiveness of visits from search change. If you notice a drop in organic sessions, compare it alongside impressions and positions in GSC to distinguish an SEO issue from, for example, a measurement issue or changes in user behaviour.
You will assess the quality of visibility most reliably through conversions configured in GA4 (e.g. purchase, form submission) and their trend over time. When you want to check whether a rise in Google really translates into results, compare landing pages that are growing in GSC with their conversions from the Organic Search channel in GA4. The “Pages and screens” report also makes it easier to understand which subpages are actually attracting organic traffic and how long users stay on them. If you see a blog post growing but not leading to the offer, strengthening internal linking and the CTA often helps, followed by measuring changes in event paths.
Attribution in GA4 can change the way sales are “assigned” to organic search, which is why it is worth monitoring SEO’s share in the whole conversion path. If organic generates a lot of traffic but little sales in the last click, review attribution reports (e.g. data-driven vs. last click) and the channel’s share in conversion paths. Also make sure that internal linking does not incorrectly use UTM parameters, as this can overwrite the session source and distort channel reports. To quickly spot outages, set alerts (e.g. in Looker Studio or external tools) for sudden drops in organic sessions of >20% week on week, as they often indicate issues such as mass 404s, incorrect noindex, or a server failure.
- 01Filter GA4 reportsSet “Organic Search” in Traffic acquisition.
- 02Analyse behaviourCheck sessions, engagement and conversions.
- 03Compare with Search ConsoleCompare impressions and positions to diagnose the issue.
- 04Assess quality through conversionsMeasure the effectiveness of visits from search.
- 05Treat it as a complementUse GA4 and Search Console data together.
The key is analysing behaviours and conversions from organic traffic in GA4, treating it as a complement to SEO data from Search Console.
What strategies should you use to analyse keywords?
You will start an effective keyword analysis by building a list of phrases you want to be visible for and assigning them to the correct URLs. In practice, as a starting point choose offer-related phrases, phrases describing the user’s problem, and long-tail with purchase intent, because this makes it easier to measure the effect later in traffic and conversions. For research, you can use tools with volumes and suggestions such as Senuto (Baza słów), Semrush Keyword Magic Tool, Ahrefs Keywords Explorer, Google Keyword Planner or AnswerThePublic. When you come across a phrase with high volume and very strong competition, consider long-tail variants (e.g. 50–200/month), because they often allow you to break into the TOP10 faster.
The most important “structuring” SEO strategy is keyword-to-URL mapping, that is, deciding which subpage should rank for which queries. In e-commerce, the typical division looks like this: categories for broad keywords, products for very specific queries, and guides for user questions. When several subpages start competing for the same intent, Google may rotate the landing pages, and the result can be fluctuating positions and a weaker CTR, so it is worth consolidating similar content and using 301 redirects or canonicals where justified. When you cannot break into the TOP20 and you have several similar pieces of content, it is usually better to build one stronger asset than maintain duplicate intents.
Prioritising keyword selection is fastest when you match search volume potential with click opportunity and conversion value, instead of spreading effort “equally” across everything. In practice, it is worth starting with keywords where you are already around positions 8–20 (“low-hanging fruit”), because often a few tweaks to the content and internal linking are enough to break into the TOP10. When expanding a content plan, gap analysis works well: in Ahrefs “Content Gap” or Semrush “Keyword Gap”, compare 3–5 competitors and choose keywords where they are in the TOP10 and your domain is not in the TOP50. At the same time, monitor CTR against position and spot queries with a high number of impressions but a low number of clicks, because this is often the simplest route to quickly improving the title, description and matching the content to intent.
What are the most common technical issues affecting indexing?
The most common technical issues affecting indexing are blocks for Google robots and errors that massively reduce the number of correctly accessible URLs. First of all, it is easiest to rule out meta robots noindex, X-Robots-Tag headers and rules in robots.txt, because an accidental block introduced after development work is a common scenario. You can carry out this check in Google Search Console (URL Inspection), verifying whether the page “is on Google” and whether any blocking signals appear. If visibility has dropped suddenly, start with this before moving on to content optimisation.
The second group of issues is redirects and 404/5xx errors, which can “remove” part of the site from the index in a short time. In Google Search Console, in Indexing → Pages, you can check reports such as “Not found (404)” and “Server error (5xx)”, and then assess whether the scale affects key subpages. For larger websites, server log analysis or a crawl report is also useful. When the source of the problem is incorrect redirects or mass 404s, the priority remains restoring proper URL accessibility.
Indexing and the stability of visibility are also affected by “systemic” issues: performance (Core Web Vitals), URL duplication and errors in structured data. If Google indexes unwanted addresses (for example, via filter and sorting parameters), visibility and crawl budget can become diluted, so it is worth tidying canonical versions and limiting the indexing of “junk” variants. In the case of rich results, a drop in the visibility of enhancements is sometimes the result of schema.org errors, which you can verify in GSC in the “Enhancements” report and in tools for testing rich results. If the drops started after changes such as a migration, a URL change or a domain change, first verify the 301 redirect map, canonicals and the freshness of the sitemap, and observe indexing in the first 2–6 weeks.
It is also worth bearing in mind that a lack of growth may result not only from indexing itself, but also from which subpages Google deems priority pages. Weak internal linking can slow down the discovery and indexing of new content, so new articles should receive links from popular pages, categories and related posts, rather than relying solely on the sitemap. For very large websites, crawl budget becomes more important, so reducing the generation of thin pages and improving server speed can accelerate indexing. Finally, although it happens rarely, check the GSC sections “Manual actions” and “Security issues”, because there you will see directly whether the problem is a manual penalty or a security issue.
How to optimise local visibility and Google Business Profile?
You optimise local visibility by treating maps (Local Pack) and Google Business Profile as important sources of visits, phone calls and route directions for local queries. Google Business Profile provides data on profile views and clicks on “Call”, “Directions” and visits to the website, which makes it easier to assess the real value of appearing in maps. To link visibility with business impact, compare these interactions with the number of leads and add event tracking in GA4, such as clicks on the phone number. This way, you can see not only “whether you are visible”, but also whether that visibility translates into user actions.
The biggest impact on matching local queries comes from categories and the consistency of company data. Set the main category in GBP as precisely as possible (for example, “Physiotherapist”, not “Medical services”) and add additional categories only when you genuinely provide those services. At the same time, ensure NAP (Name, Address, Phone) consistency on the website, in the GBP profile and in directories, because discrepancies reduce trust in the local algorithm. If a competitor is higher in maps, differences in NAP and categories are among the first things worth verifying.
Reviews and profile refinement also affect conversions from maps and, indirectly, visibility. Reviews strengthen CTR and trust, so in practice aim for steady growth (for example, 5–20 new reviews per month depending on the industry) and reply to all of them, because activity increases the profile’s credibility. Also keep the profile up to date: authentic photos of the team and premises, correct opening hours, services and regular posts (for example, once a week) with offers or news. If you are developing content on the website for local keywords, the landing page should include information about the service area, directions, services and FAQ, and create separate city subpages only when they add unique value, so as not to risk thin content.
In more competitive locations, citations and local links also matter, but their quality carries more weight than sheer quantity. Instead of adding the business to mass-produced, low-quality directories, it is better to target partnerships and local sources (e.g. chambers of commerce, sponsored events, local media) that genuinely strengthen credibility. It is also worth remembering that local results depend to a large extent on the user’s distance, so one “maps position” does not exist in an absolute sense. For this reason, assess the effects of local optimisation by the trend in interactions with the Google Business Profile and the number of leads, rather than by a single result checked manually.
FAQ
Frequently asked questions
How do you check a site’s true position in Google for a specific keyword?
First, you need to specify the query, location, device and moment of measurement. Only then can the result be compared reliably, because the position changes depending on these factors.
Does the average position in Google Search Console show the site’s true ranking?
No, because it is an average of many impressions, not a fixed position for one keyword. Such a result may reflect different positions depending on the query, device and personalisation.
Why is a site’s visibility more important than a single Google ranking?
Because it shows how many keywords the site appears for high in the results, not just one position for one keyword. The trend in clicks, the number of keywords in TOP3/TOP10 and total traffic better reflect the SEO effect.
Which tools are best to use for monitoring rankings and visibility?
It is best to combine Google Search Console, GA4 and a rank tracker. GSC shows real queries and search metrics, GA4 shows behaviour and conversions, and a rank tracker regularly tracks selected keywords.
How do you use Google Search Console to assess a site’s visibility?
It is worth analysing the “Performance” report with country, device and date range filters, and comparing periods, e.g. 28 days with the previous 28 days. You need to look at clicks, impressions, CTR and average position together, not separately.
How do you check in Google Analytics 4 whether organic traffic delivers results?
In GA4, you should filter the Organic Search channel and observe user behaviour and conversions. This shows not only traffic, but also what users do after arriving from search.