

Google Trends is a straightforward tool that in SEO lets you see how interest in a given topic changes over time, broken down by region and search type. It does not provide an exact number of queries, only proportions and momentum, so it works best for making decisions rather than calculating traffic potential down to the last visit. In practice, it helps with topic selection, assessing seasonality, comparing keyword variants and choosing the best publishing time. Used well, it lets you filter out weaker ideas more quickly and focus on those that have a real basis in the data. The most important thing is that Google Trends shows the context of interest, but it does not replace Search Console, search results analysis or business data. In this article, you will see how to read this information so that it genuinely supports SEO decisions.
How Google Trends supports SEO decisions in practice
Google Trends supports SEO decisions because it shows whether a topic is growing in popularity, declining, seasonal or varying by region. That is often enough to choose topics more accurately, set content priorities and plan publications. Instead of relying on gut feeling, you can verify whether interest is steady, short-lived or appears only in selected months.
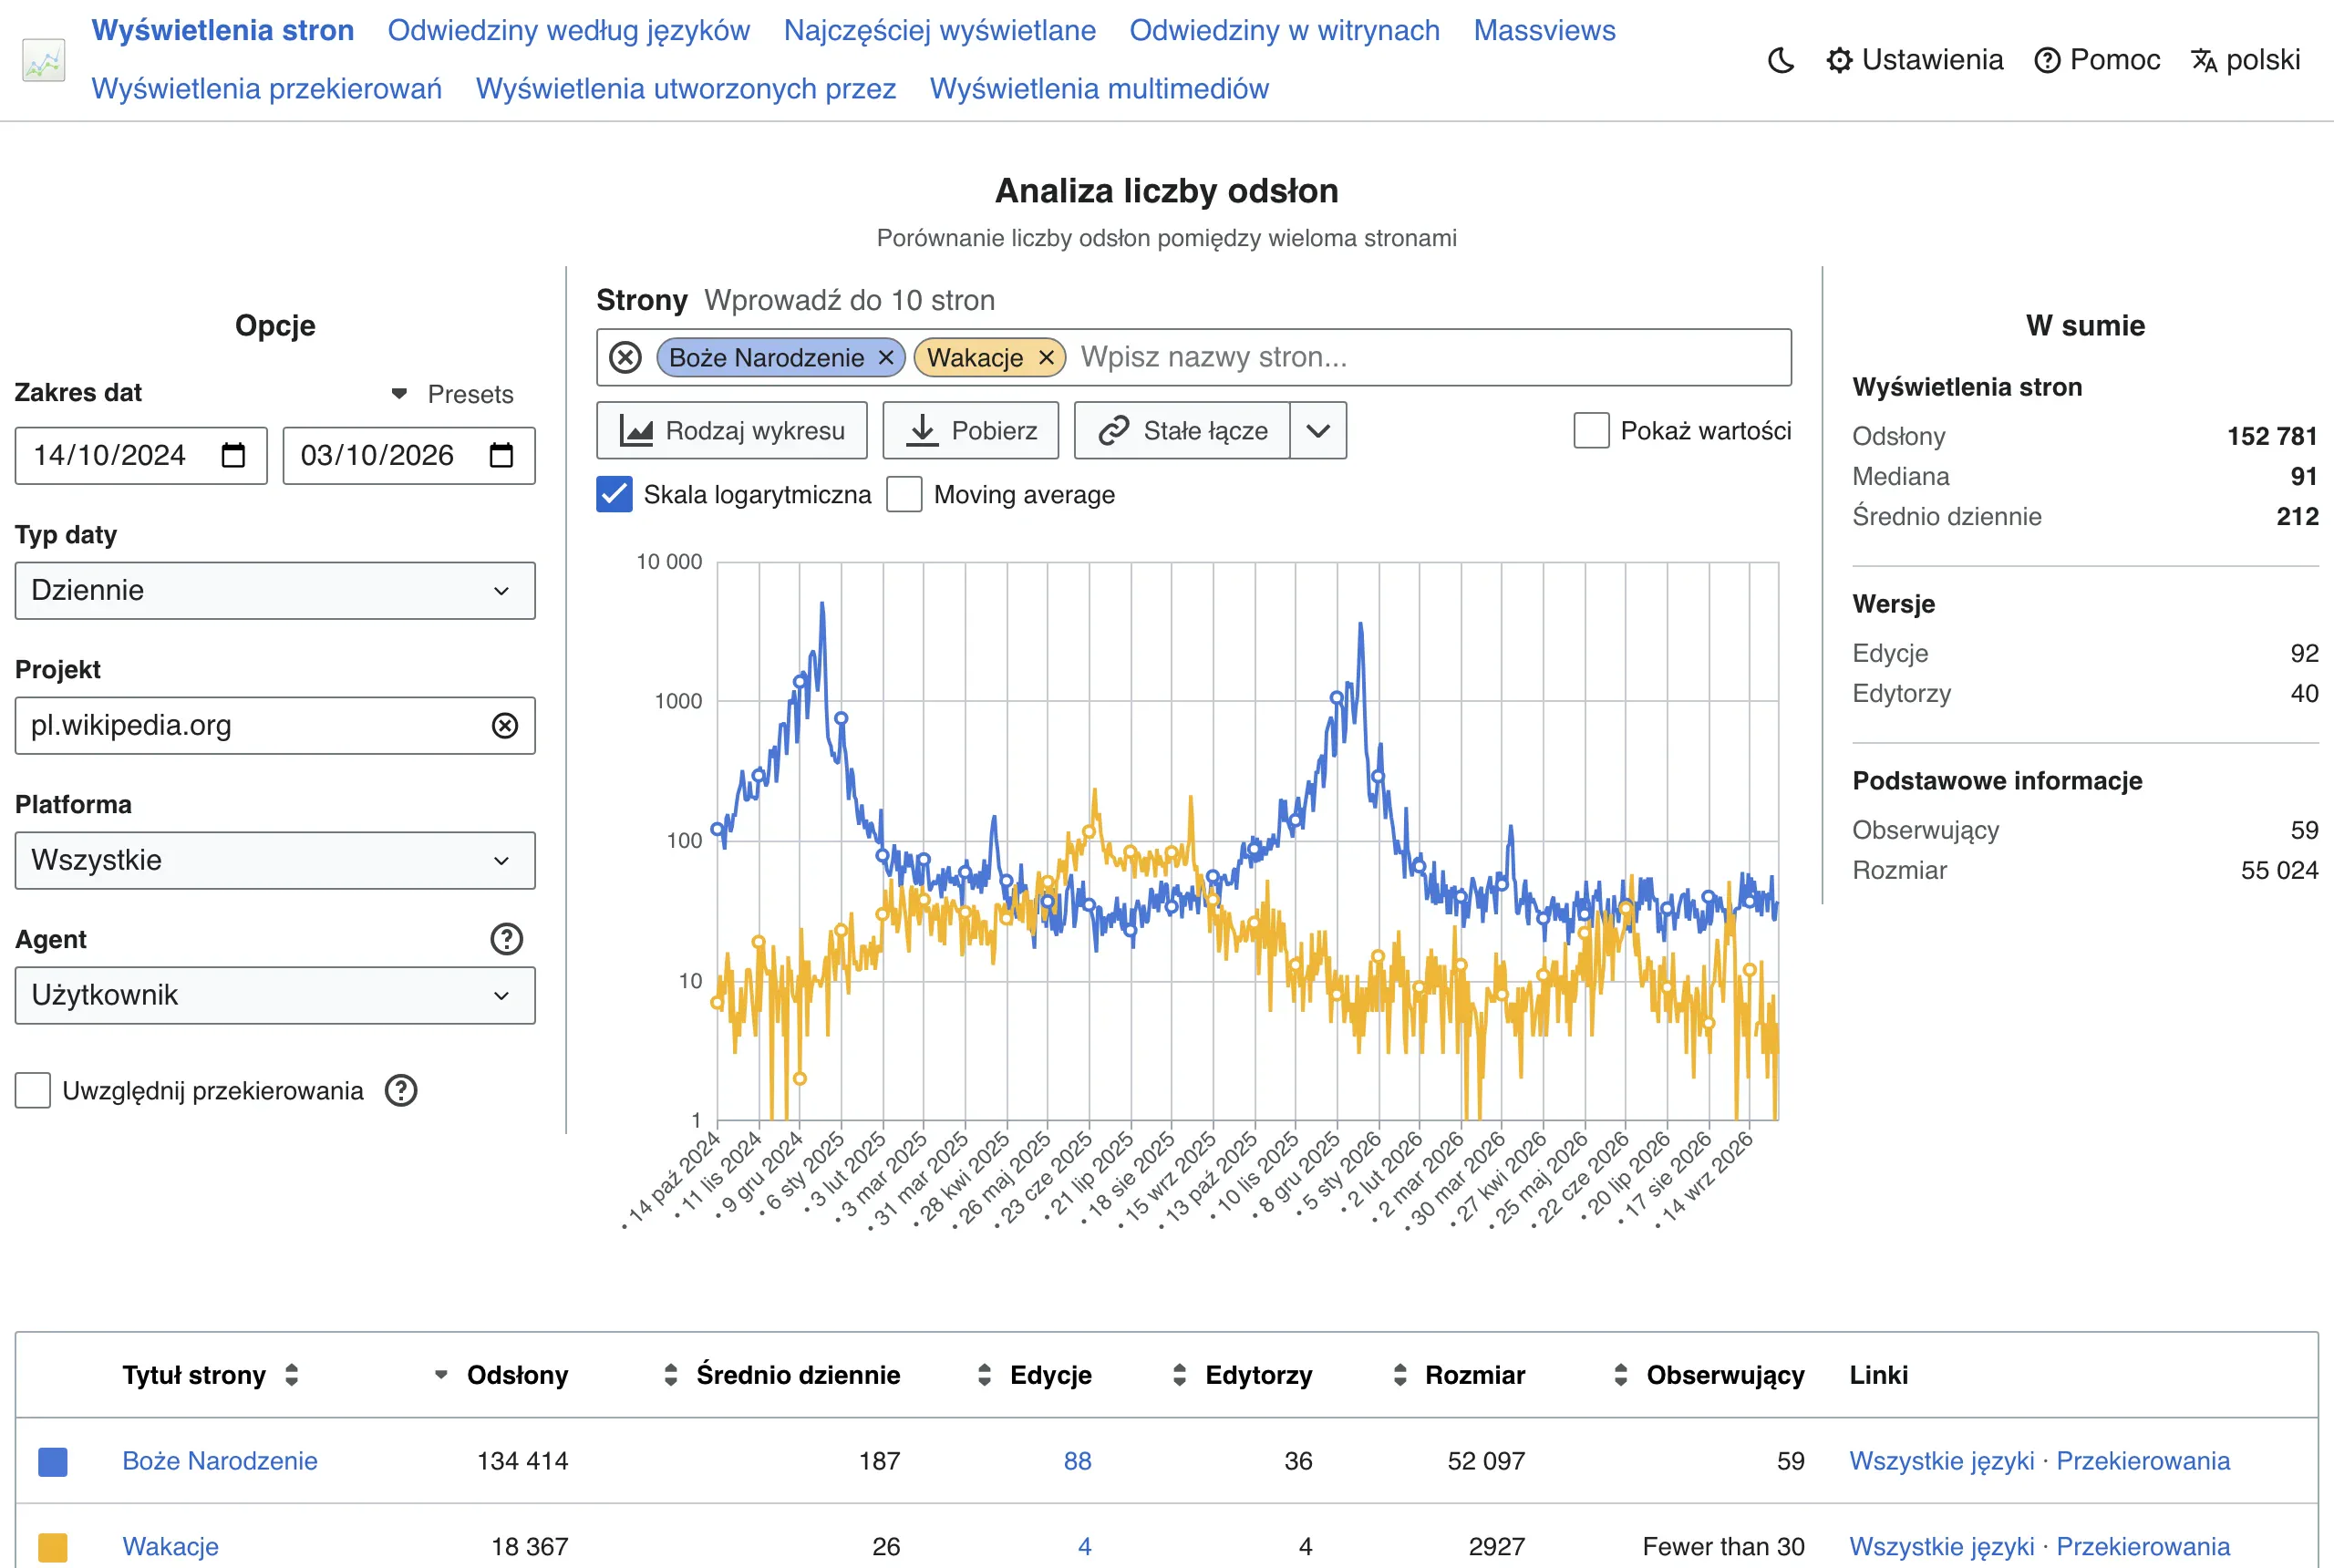
The most common use is comparing several variants of the same keyword. This makes it easier to decide whether to write for one dominant name or include several versions in headings, the introduction and the FAQ. Comparing variants only makes sense when you analyse them with identical settings for country, time, category and search type.
The second important use relates to seasonality. When the chart repeats a similar increase every year, you can prepare a landing page in advance, refresh an existing article or expand a content cluster before the peak of interest. In practice, this gives you an advantage because the content has time to be indexed and build visibility before demand rises significantly.
Google Trends also makes it easier to assess geographic differences in interest. This is useful in local SEO, when creating regional pages and when adapting naming to how users actually search for the topic in different parts of the country. If the data shows clear differences between regions, it is worth adapting not only the keywords, but also the examples, headings and landing page structure to the local context.
Another practical function is related topics and queries. Based on these, you can identify subtopics for a cluster, questions for the FAQ section and new threads worth adding to existing content. This works particularly well for updates, when the topic shifts semantically and users start asking about different issues than they did just a few months earlier.
It is also worth bearing in mind that Trends does not answer the question of whether a given topic will deliver quality traffic or whether it can be ranked easily. A high trend may simply be a signal of short-lived informational interest that does not have to translate into clicks, leads or sales. That is why it is a good idea to verify insights from Trends with SERP analysis, Search Console data and an assessment of user intent.
- 01Popularity checkInterest rising, falling, stable
- 02Seasonality analysisDetecting trends over time
- 03Comparison of variantsChoosing dominant keywords
Checking trends and seasonality for more accurate topic selection and content planning.
How to set up Google Trends for effective analysis
A reliable analysis in Google Trends starts with setting the right context: country or region, time range, category and search type. These parameters can significantly change the picture of the data, so they determine whether you draw accurate conclusions. With the wrong configuration, even a correctly read chart can lead to a poor decision.
Start by defining the purpose of the analysis. Different settings will be useful for checking seasonality, comparing two keyword variants, and still others in the case of local SEO. When the goal is clearly defined, it is easier to choose the time horizon and avoid mixing several research questions on one chart.
Adjust the time range to the scale of the topic. For seasonality, it usually pays to look broader, for example at several years, to see a recurring cycle rather than a one-off spike. In small niches or where demand is weak, too short a period often ends in unstable or sparse data, so it is worth testing a longer range and sometimes expanding the region being analysed.
Set the country and region in line with the market you are actually competing in. For a local site, a global perspective usually adds little, because it dilutes the signal and blurs linguistic and regional differences. If you operate locally, check not only the country but also voivodeships or cities, because that is where you can see where the topic has real strength.
Category becomes meaningful when a word is ambiguous. It helps filter out irrelevant interpretations and better tailor the analysis to the industry. It is also worth deliberately choosing whether you are analysing a keyword or a topic, because with proper nouns and ambiguous phrases a topic can be more reliable than the exact phrase entered.
The type of search changes the perspective of the analysis. Data from the main search engine can look different from YouTube, Images or Shopping, and this has a direct impact on decisions about content format. If you are planning a video guide or a page targeting product keywords, checking the right search type gives a more practical signal than a general analysis.
Finally, compare queries within one set of settings and only then interpret the differences. Do not change the country, time period or search type during the analysis if you want to assess which keyword is stronger. The most common mistake is drawing conclusions from charts set against different configurations, because then you are comparing not keywords, but different research conditions.
Analysing seasonality and trends in Google Trends
Analysing seasonality and trends in Google Trends comes down to checking when interest in a given topic rises, when it falls, and whether that pattern returns every year. In SEO, this helps decide whether to prepare evergreen content, a strictly seasonal piece, or simply boost an existing page just before the expected increase. The most useful insight comes from a longer time horizon, because only then do recurring cycles become visible, rather than isolated spikes. If you want to assess seasonality, start with a 12-month range, and for important topics also check 5 years.
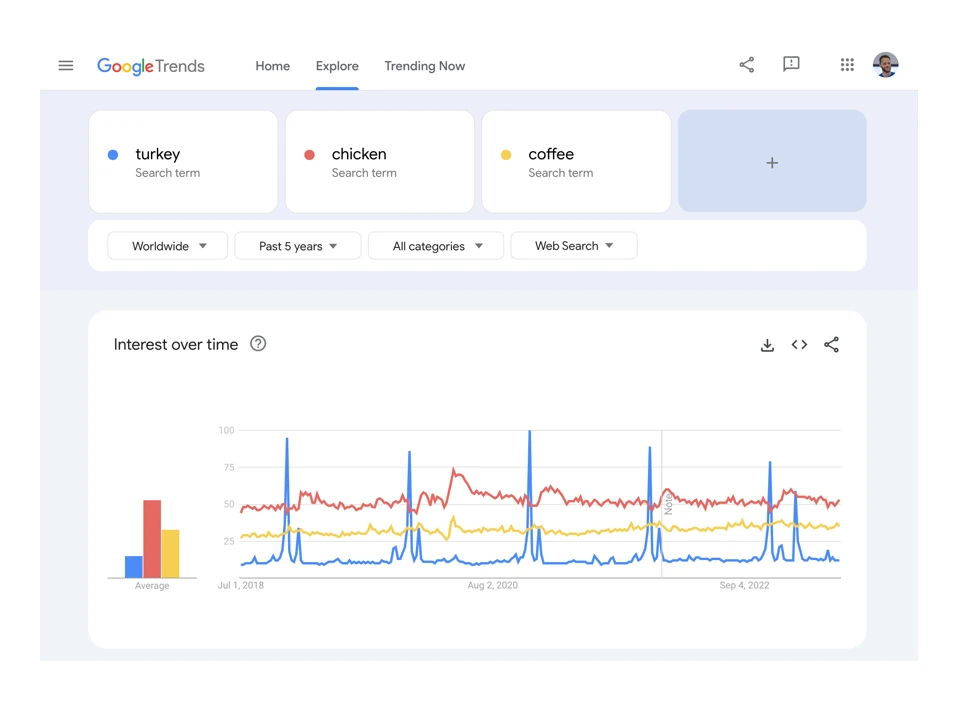
On the chart, it is worth separating three phenomena: regular seasonality, a sustained upward trend, and short-term noise. A regular season is recurring peaks at similar times of year, for example before Christmas, during the holiday period or around tax returns. An upward trend means interest in the topic is growing over the long term, which may justify building a larger content cluster. A one-off spike can be the result of a single media event and does not always translate into real business value.
In practice, it is better to schedule publication so that it precedes the rise, rather than aiming for the peak itself. Google needs time to index the page, assess its quality and build visibility, which is why seasonal content is often better published or refreshed a few weeks earlier. The most common mistake is planning content exactly for the moment of peak interest, when the competition is already visible and the new content starts too late.
Trends is also useful when comparing keyword variants, provided you compare them with identical settings. You can compare language forms, colloquial names and more formal ones, and then choose the dominant variant for the title, headings and content structure. If the charts are erratic or almost empty, the cause is often too little demand or too short a time frame. In that case, extend the period, check a broader region, or compare the phrase as a topic rather than as a literal search term.
It is also worth looking at related queries and topics, because they often show how user intent is shifting. If new questions are growing around the main term, that is a sign that the old article may no longer fully satisfy audience needs. Rising related queries are often a better signal for updating content than the main trend chart itself. This is especially important in technology, finance, health and product areas, where the meaning of queries can change quickly.
It is also important to remember that Google Trends does not show the number of searches, but relative interest within the selected dataset. A value of 100 means a local peak in popularity, not a specific volume. For this reason, the chart will not answer how much traffic you will get, only whether the topic is gaining momentum, losing interest or recurring cyclically. The decision on a topic’s priority should be confirmed in Search Console, SERP analysis and an assessment of the real chance of ranking.
- 01Cycle identificationDetect recurring growth patterns
- 02SEO decisionEvergreen, seasonal or update?
- 03Long horizonAnalyse 12 months and 5 years.
Regular seasonality, a sustained trend and short-term noise on one chart
How to assess geographical interest in topics
Geographical interest in topics in Google Trends is assessed by checking in which countries, regions or cities a given query reaches relatively the highest popularity. This is not just an interesting detail, but a practical hint when localising content, choosing wording and setting SEO priorities. When a topic is clearly growing only in selected areas, a general article for the whole country can be less effective than a regional landing page or a locally tailored section of the site.
First and foremost, look at regions through the lens of the business objective. If you sell locally, what matters is not so much nationwide data as specific voivodeships, cities and the naming conventions used by audiences in a given area. If you operate more broadly, geography will help identify places where you should strengthen visibility, run content activities or develop local subpages. Regional differences often stem not from demand itself, but from different ways of naming the same need.
This matters a great deal when comparing keyword variants. In one region users type the official name, in another the colloquial one, and elsewhere they search for a more specific service or product. In SEO, this translates into page titles, headings, FAQ, anchor text and examples in the content. A well-prepared local page does not stop at inserting the city name, but uses the language people actually use in that location.
When interpreting geographic data, you need to bear in mind scale and normalisation. A region with a high score does not have to have the largest number of searches, only the highest share of interest relative to other topics in its area. This matters because a small region may look “strong”, even though a larger market with a lower relative score may be more important commercially. That is why data from Trends is best compared with information on sales, service availability and the historical effectiveness of local pages.
If there is little data, do not draw far-reaching conclusions based on a single city or voivodeship view. Niche topics locally often require a longer time range, and sometimes also analysis at country level, only then narrowed down to a region. When a local chart is unstable, it is better to treat it as a supporting signal rather than the basis for creating a separate page. This reduces the risk of expanding the site with many weak subpages without real demand.
In practice, geography in Trends is most useful for local SEO, regional expansion and planning content for different markets. It helps decide where separate landing pages are needed, where one page with regional sections will suffice, and where neutral naming is better. Valuable conclusions appear only when you combine the local trend with analysis of search results, competition and user intent in a given place.
Using related topics and queries in a content strategy
Related topics and queries in Google Trends help expand a content strategy with real threads that users add to the main topic. It is one of the simpler ways to check how search intent evolves and which questions are worth covering in an article, cluster or landing page. In practice, it is not about mindlessly copying a list of phrases, but about understanding what the user is searching for “alongside” the main term. The biggest value of these sections lies in spotting subtopics that are only just beginning to gain importance, before they become obvious in standard keyword tools.
It is worth distinguishing between the related topics section and related queries. Topics better reflect the broader semantic context, especially with ambiguous names, brands and concepts that can be interpreted in several ways. Queries are more useful when you are planning headings, FAQ sections, supporting sections and specific expansions in the content.
The most practical application is building topic clusters. If the main topic has several related queries that are growing steadily, you can treat them as separate sections within one piece or as supporting articles linked to the main page. If a related query shifts the focus of the topic, it is usually a sign that a cosmetic update of a few sentences will not be enough and that the content structure needs to be rebuilt.
When analysing, pay attention not only to popularity, but also to whether the given thread fits the page’s goal and user intent. A growing query may indicate informational interest, while your subpage is transactional in nature, which makes it harder to match the content to the SERP. Google Trends is good at suggesting the direction for content expansion, but on its own it does not confirm that a given phrase will be easy to rank for or that it will translate into business value.
A good habit is to compare new related queries with the current SERP and data from Search Console. If growing threads are already appearing in search results as separate content types, it is worth splitting them into separate subpages. If, however, Google aggregates them under one result, it is more often better to expand the existing piece than to create a new one.
- 01Detecting intent evolutionDiscover growing threads.
- 02Understanding user contextLearn the broader background.
- 03Topics vs. queriesBroader context vs. phrases.
- 04Value of future trendsStay ahead of standard tools.
Key: understanding what the user is searching for “alongside” the main term, for a better content strategy.
Planning and SEO optimisation based on trends
Planning and SEO optimisation based on trends comes down to decisions about what to publish, when to publish and which content to develop or refresh based on changes in interest over time. This approach is particularly useful when resources are limited and priorities need to be set deliberately. Instead of creating content at an even pace throughout the year, you can align the calendar with real demand. In SEO, the timing of publication often affects not so much rankings themselves as whether the content manages to build visibility before the peak in interest.
To begin with, define what kind of trend you are working with. Stable growth usually justifies investment in evergreen content and a sizeable content cluster. A seasonal trend more often means the need for cyclical updates, earlier publication and creating subpages that you will strengthen before the recurring peak.
In practice, based on Trends, you usually make four types of decisions:
- whether to prepare a new page or expand an existing one,
- which topics should be prioritised in the publication calendar,
- whether a separate seasonal or regional page is needed,
- which content should be refreshed before the expected increase.
When optimising existing content, pay attention to whether the topic has shifted semantically. As new related queries appear, users may now expect different examples, fresher comparisons or additional sections that were not there before. An SEO-effective update is not just changing the date and a few paragraphs, but adapting the content to the current version of search intent.
Trends also make it easier to set priorities between similar keyword variants. If two terms describe the same problem, but one gains a clear advantage over time, it is worth basing the title, headings and internal anchors on it, and treating the other as semantic support. This does not mean the weaker variant should be ignored, only that the main content architecture should follow the dominant terminology.
Finally, always assess whether the trend translates into business value. High or growing interest can be linked to media, educational or short-lived topics that do not support the page’s objective. The safest working model is to combine Google Trends with SERP analysis, Search Console, domain visibility and an assessment of conversion potential.
Most common mistakes and pitfalls when using Google Trends
The most common mistakes in Google Trends include confusing trend with volume, drawing conclusions from unstable data and making decisions without confirmation from other sources. This tool shows the relative level of interest over time, not the number of searches. A score of 100 means the peak of popularity in a given comparison set, not concrete demand. If you treat the chart as hard market data, you can easily overestimate the topic’s potential.
The second common pitfall is comparing keywords with different settings. Changing the country, time range, category or search type completely changes the context, making the results no longer comparable. Any comparison only makes sense when all analysis parameters are identical. In practice, it is a good idea to save the settings before you even start, so you do not mix up the data during the analysis.
Wrong conclusions often result from analysing too small a sample. With niche topics, a short time horizon or a very limited region, the chart can become jagged, sparse in data or appear random. This does not always indicate a lack of interest, but more often a lack of a stable base for comparison. If the topic is small, extend the period and broaden the region, and only then narrow the analysis.
Many people also overestimate sudden spikes in interest. A one-off increase may be the result of news, seasonality, a media campaign or a short-lived trend and does not have to mean a lasting SEO opportunity. Rising queries marked “Breakout” are especially worth interpreting carefully, because they show a sharp increase compared with the previous level, often starting from a low base. First check whether the growth is sustained over time and whether it makes business sense before building a new section of the site around it.
A separate mistake is confusing “search term” with “topic”, especially with ambiguous names. When a given word can mean a brand, product, person or phenomenon, a simple text query can gather too broad or inappropriate a context. In such situations, a topic works better because it organises the semantic meaning. If you do not separate these, it is easy to start optimising content for the wrong intent.
The most costly pitfall is making decisions solely on the basis of Trends. Rising interest does not yet tell you whether a keyword generates clicks, whether the SERP offers a real chance to rank, or whether the traffic will convert. Google Trends should be treated as a tool for direction and priority, not as standalone proof that a topic is commercially worthwhile. That is why the final decision is best confirmed in Search Console, search results analysis and business data.
FAQ
Frequently asked questions
How does Google Trends help SEO decisions in practice?
It shows whether a topic is growing, losing popularity, has a seasonal pattern or differs by region. This makes it easier to choose topics, prioritise content and plan publication.
Does Google Trends show the exact number of searches?
No, the tool shows relative interest and dynamics, not a specific query volume. A value of 100 means a local popularity peak, not the number of visits.
When is the best time to publish seasonal content according to Google Trends?
It is best to publish or refresh it a few weeks before the expected rise in interest. This gives the content time to be indexed and build visibility before the peak.
How should Google Trends be set up to compare two keywords?
Compare them with identical settings for country, time, category and search type. Only then does the result show the difference between the keywords rather than between configurations.
Why is it worth checking regions in Google Trends?
Because interest in a topic can vary significantly depending on the country, voivodeship or city. This helps you tailor keywords, headings, examples and the site structure to the local context.
What do topics and related queries in Google Trends provide?
They help you find subtopics, questions for the FAQ and new angles to expand the content. They are also a signal that the user intent may have changed and the article needs updating.