
TTFB is one of the key metrics right at the start of page loading, because it shows how quickly the server begins responding to a request. In practice, however, it is not only about the server itself, but about the whole path the request takes: DNS, TLS, CDN, reverse proxy, the application and the database. An elevated TTFB may be the result of either network-side issues or an overloaded or poorly designed backend. First you need to determine whether the delay occurs before reaching the origin, or only during application processing. This matters because these two scenarios are optimised with completely different methods. In this article, we will go through the topic in a practical way: from understanding the metric, through diagnosis, to concrete ways of reducing response time.
What is TTFB and why is it important?
TTFB is the time measured from sending an HTTP request to receiving the first byte of the response from the server. It includes not only the application itself, but also the network layer, TLS negotiation, any passage through a CDN or proxy, and all the work the server must do before it starts sending the response. For this reason, TTFB is not a simple measure of “hosting speed”. It more accurately shows how efficiently the entire request-handling path works.
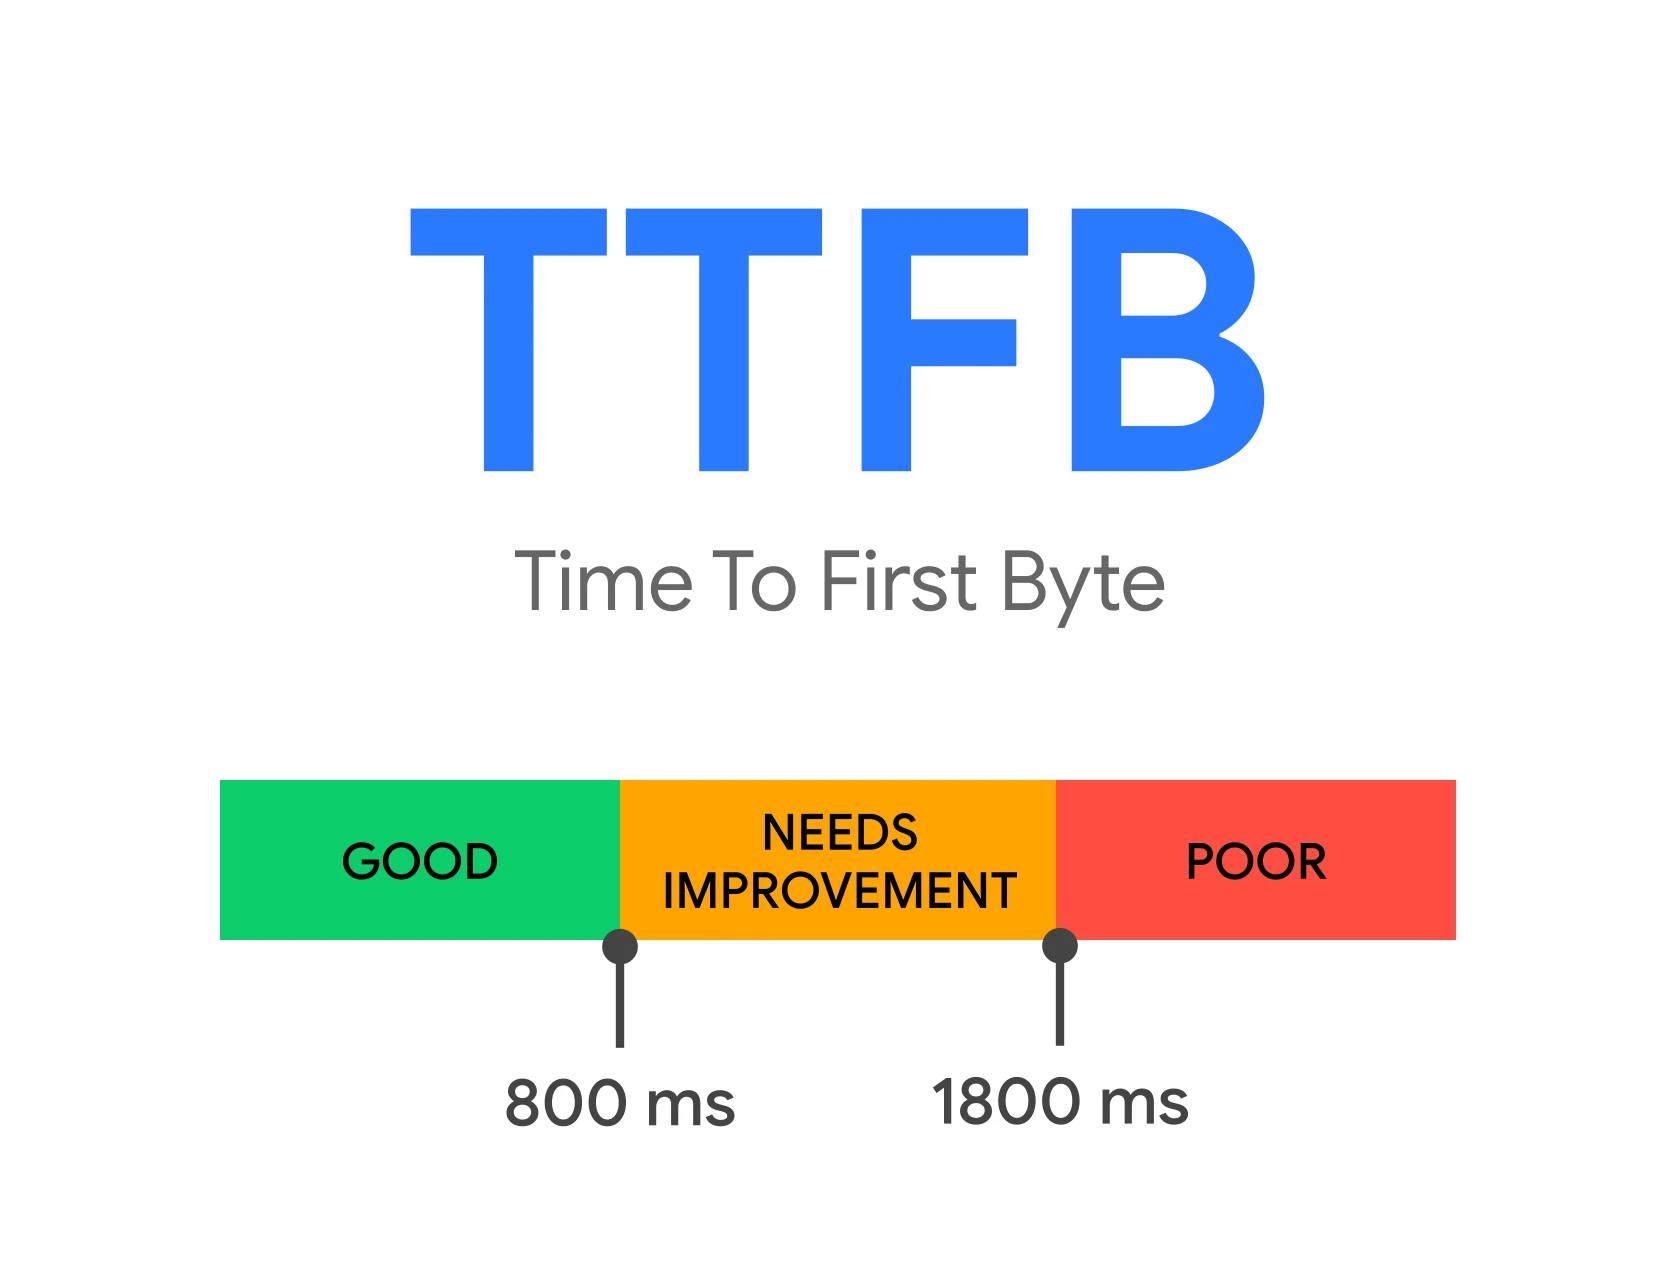
From the user’s perspective, TTFB matters because it affects the moment when HTML starts downloading, and then the page’s subsequent resources. When the first byte arrives late, the browser begins parsing the document later, and the rest of the rendering process is shifted in time. A low TTFB does not guarantee a fast page display, but a high TTFB almost always slows down the start of loading. This is especially visible on pages that generate HTML dynamically on the server side.
In practice, TTFB largely depends on whether the response can be served from cache or needs to be generated from scratch. On dynamic services, the difference between a cache-hit and a cache-miss can be significant, because full rendering triggers application logic, the database and external integrations. In the case of static files, improving TTFB usually comes down to shortening the network path and serving assets correctly from edge cache. If the same URL is fast one time and slow the next, the problem is very often the lack of effective cache or backend instability.
TTFB consists of several layers, and each of them can become a bottleneck. Sometimes the culprit is slow DNS or an inefficient route to the origin, and other times it is costly middleware, authentication, session handling or too many database queries before the HTML is sent. It also happens that external APIs, the payment system, a geolocation module or an anti-bot tool block the response. That is why a sensible TTFB analysis should start by breaking the result down into stages, rather than guessing.
From a business perspective, TTFB matters because it affects both UX and the technical health of the system at the same time. If it rises as traffic grows, it can be a sign that the infrastructure or application is not scaling as expected. If, however, it is high only for certain types of subpages, it most often points to a specific category of causes, such as slow SQL queries or an inadequately chosen cache strategy. For this reason, it is better to monitor TTFB per endpoint rather than rely on one average for the entire site.
Current context and challenges related to TTFB
The biggest difficulty when working with TTFB is that a single average for the whole site usually obscures the picture. The homepage behaves differently from a listing, a product page, a blog post, an API response or an error page. On top of that, there is the distinction between anonymous and logged-in traffic, where personalisation and authentication often prevent full page caching. TTFB should be considered separately for page types and user scenarios, because only then is it possible to identify the real source of the delay.
In modern deployments, intermediate layers such as CDN, WAF and reverse proxy play an important role. With a cache-hit, they can noticeably reduce TTFB, but with a cache-miss, poorly configured rules or additional security checks, they can also increase it. In practice, it is therefore worth establishing whether the delay occurs at the edge, during the trip to the origin, or only on the application server. Without this separation, it is easy to optimise a layer that is not actually the real bottleneck.
It is often assumed that simply switching to HTTP/2 or HTTP/3 will solve the problem, but that is only part of the picture. A newer protocol may improve transport, transmission prioritisation and connection behaviour, but it will not speed up slow business logic, shorten heavy SQL queries or relieve an overloaded backend. If the application needs several hundred milliseconds or more just to begin responding, a protocol change alone will bring a limited effect. That is why measurement should separate the network layer from processing time on the origin side.
Increasingly, unstable first responses also appear after periods of inactivity. This applies to cold starts, autoscaling, waking containers, process restarts and some serverless architectures. In such situations, a one-off test may produce an excellent result, while the first real user after a break will see a much higher TTFB. If you measure only “warm” responses, it is easy to miss a problem that affects real traffic the most.
External dependencies are a separate category of issues. Integrations with CMS API, search, a recommendation engine, payments or an anti-bot service can delay response generation even before the first byte is sent. A chain of unnecessary redirects, multi-stage rewrites and excessive middleware running before the application reaches the actual logic works in a similar way. In practice, improving TTFB often is not about “speeding up the server”, but about eliminating actions that should not block the start of the response at all.
How to measure and analyse TTFB in practice?
TTFB is worth measuring only once you break the result down by specific request types, infrastructure layers and user context. One average for the whole site tells you very little, because the homepage behaves differently from a product page, API, logged-in dashboard or an error response. The most useful measurement is TTFB per URL or per endpoint type, split into cache-hit, cache-miss, anonymous and logged-in traffic.
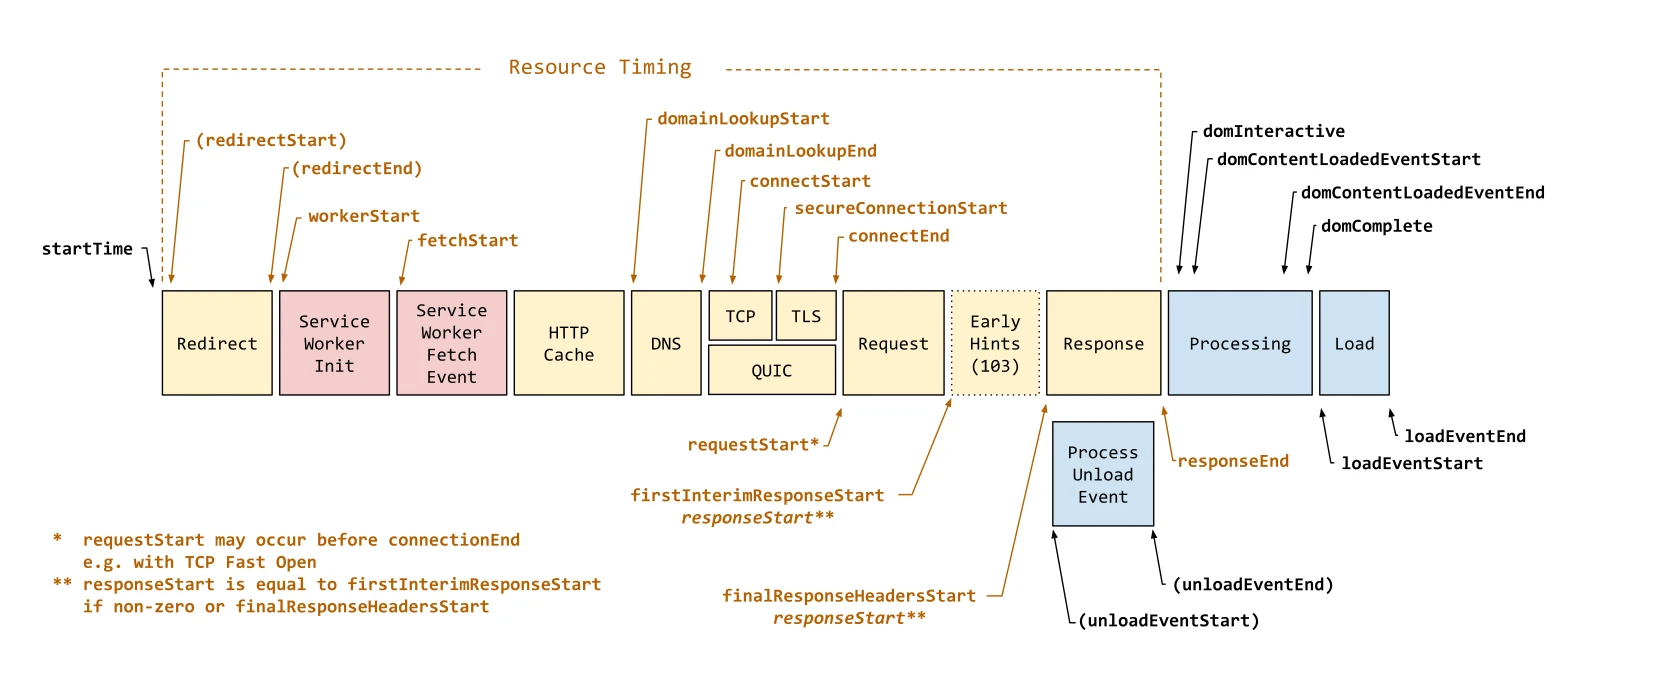
In analysis, it is not only the time itself that matters, but also where it is being generated. The request path includes DNS, connection setup, TLS, CDN or WAF, load balancer, web server, application, database and any external services. If the delay builds up before reaching the origin, the causes usually lie in the network or at the edge layer. If it only grows once it reaches the origin, the source is usually the application, database or integrations.
It is also a good idea to segment the data by region, time of day, HTTP method, response status and the system state after deployment or restart. This matters because some issues only appear during peak hours, after a cold start or during autoscaling. A one-off test from a single location does not show the real TTFB experienced by users.
For reliable diagnostics, it is best to combine several sources of information. Server logs will show response times and statuses, tracing or APM will let you follow framework bootstrapping time, middleware, sessions, authorisation, rendering and database queries, and the slow query log will identify specific SQL operations that block the first byte from being sent. This full set of data makes it easier to pinpoint the stage that is actually slowing the response, rather than relying on guesswork.
It is especially valuable to compare responses with and without cache. If cache-hit has a low TTFB and cache-miss is noticeably slower, the problem usually is not transport, but response generation on the origin side. A large difference between cache-hit and cache-miss usually means that the biggest improvement potential lies in the cache strategy, invalidation or simplifying rendering.
It is worth closing the analysis with a simple bottleneck map. For each key endpoint, it is good to establish where the time is being lost. Are redirects to blame, middleware, database connections, external calls, missing indexes, worker queues, or perhaps an unsuitable reverse proxy configuration? Without this kind of understanding, it is easy to introduce improvements that sound sensible on paper, but in practice do not shorten TTFB where it is most needed.
TTFB optimisation strategies
TTFB improves mainly by removing actions that have to happen before the first byte of the response is sent. In short, it is about a shorter request path, less work on the application side and smarter use of cache. First, it is worth targeting the slowest stage, instead of trying to fix everything at once.
The biggest impact usually comes from response caching. For content without personalisation, the best approach is to serve HTML or data from a CDN, reverse proxy or application cache, without querying the origin. For logged-in traffic, full page cache is usually not enough, so fragment cache, data cache and caching the results of expensive queries work better. If the user does not have to wait for server-side rendering, TTFB drops fastest.
The second common source of gains is simplifying backend logic. In practice, this means less middleware, fewer redirects, fewer rewrites and less work being done before the server even starts responding. Information that is not relevant to the first view can be fetched later or moved to asynchronous tasks. The same goes for external integrations that should not block the generation of the first byte.
The database very often has a direct impact on TTFB. You need to reduce the number of queries, eliminate the N+1 problem, add missing indexes, shorten connection wait times and check whether the application is fetching too much data before sending HTML. Every unnecessary query executed before the response extends TTFB more than a later stage of rendering in the browser.
It is also worth refining the request-handling infrastructure itself. This is helped by correct keep-alive settings, TLS session reuse, pooling for connections to the database and internal services, sensible worker limits and control over request queues. If the origin is located far from users, a closer server location or better use of edge cache may improve things. Moving to HTTP/2 or HTTP/3 can improve transport, but it will not solve a slow backend.
External services deserve separate attention. Payments, geolocation, CMS API, the search engine, recommendations or an anti-bot system can hold up a response if the application waits for them synchronously. That is why it is worth setting short timeouts, fallbacks and result caching, and moving these calls away from the critical response path. A single integration without a timeout can ruin the TTFB of the entire site, even though the rest of the system is working correctly.
After deploying changes, it is worth verifying the result for the same endpoints and segments from which the analysis started. Cache-hit is compared with cache-miss, anonymous traffic with logged-in traffic, peak hours with off-peak traffic, as well as behaviour after restarts and after releases. TTFB can be easily worsened by new middleware, an integration or changes in queries, so continuous monitoring is just as important here as the optimisation itself.
The importance of cache in reducing TTFB
Cache is essential for TTFB because it makes it possible to send a response back without running the full application logic and without waiting for the database. When HTML or a static asset is in a CDN, reverse proxy or application cache, the server can return the first byte noticeably faster. In practice, this is often the simplest way to improve the result. The biggest effect usually comes from increasing the share of responses served from cache, rather than simply speeding up a single render.
The key is to compare cache-hit with cache-miss for specific page types and endpoints. If a cache hit has a good TTFB and a miss performs very poorly, the source of the problem should be sought in the response generation path on the origin side. Such a result quickly sets priorities: refine the cache strategy, invalidation and the rules that determine when the cache is bypassed. If cache-hit is fast and cache-miss is slow, the problem is usually not in the transport itself, but in the backend.
Cache effectiveness is often undermined by overly granular keys and unjustified response variation. Typical reasons include cookies added to every request, URL parameters with no business relevance, Vary headers set too broadly, or full personalisation where a single shared variant would suffice. Overly specific cache keys can effectively disable cache even with a correct CDN or reverse proxy configuration.
For logged-in traffic, full-page cache often will not work, but that does not mean there is no room left for speed improvements. In that case, fragment cache, object cache and reducing the number of operations needed before the HTML is sent usually deliver the best effect. It is also worth assessing whether the page is waiting for data that could be fetched later or prepared asynchronously.
Cache should be not only fast, but also predictable after changes are published and under heavy load. Too short a lifetime for entries, aggressive clearing after every update, or the lack of a warm-up after deployment increase the number of cache misses and worsen the first responses. A well-designed strategy is one that balances sensible data freshness with a high share of responses served without contact with the origin.
Avoiding mistakes and pitfalls when optimising TTFB
Mistakes in TTFB optimisation are easiest to avoid when the source of the delay is first identified precisely and only then are adjustments introduced. The most common mistake is to improve everything at once, without determining whether the delay comes from DNS, CDN, WAF, origin, application, database or an external integration. Such an approach usually brings limited results and blurs the picture of what actually worked.
The second typical mistake is making decisions on the basis of a single average for the entire website. The homepage, product page, listing, API, customer panel and error response follow different processing paths and have different constraints. Do not combine anonymous traffic, logged-in traffic, cache-hit and cache-miss in one result, because such a report leads to false conclusions.
A pitfall is also the belief that the problem will be solved solely by changing the protocol, CDN or compression. HTTP/2, HTTP/3 and edge cache help, but they do not eliminate slow database queries, costly framework bootstrapping, excess middleware or delays on the side of external services. If the backend takes a long time to generate a response, the transport layer will improve the result only partially.
In practice, many teams underestimate the cost of redirects, rewrites and checks performed before the main logic is launched. Successive HTTP→HTTPS, www/non-www, geolocation, anti-bot and additional middleware rules can lengthen the response even before the application starts building the HTML. The shorter the request path, the greater the chance of a stable TTFB.
A separate pitfall concerns external services. When the first byte is waiting for a response from a payment system, CMS API, recommendation engine, search engine or security service, even a single slowdown in such an integration raises the TTFB for the entire page. That is why it is worth configuring timeouts, fallbacks and result caching, and moving non-critical tasks away from the moment of generating the first response.
Finally, the topic of regressions after deployment is often overlooked. A new module, an additional query, a change in cache policy or restarting processes after deployment can increase TTFB without any obvious error in the application. Every optimisation needs to be confirmed by measurement after deployment and monitored over time, especially during peak hours and after restarts and scaling.
Monitoring and maintaining a low TTFB after changes are deployed
Maintaining a low TTFB after deployment comes down to continuously measuring response time for specific request types and quickly catching regressions. A one-off drop in TTFB after an optimisation does not guarantee anything, because the result often worsens after subsequent releases, cache changes or increased traffic. For that reason, monitoring should show not only the average for the entire site, but also differences between endpoints, regions and request-handling paths. The most important thing is to observe TTFB where the business actually makes money: on landing pages, listings, product pages, checkout and API.
The most useful approach is separate monitoring of anonymous and logged-in traffic, and splitting the results into cache-hit and cache-miss. These groups have different response times and usually different sources of problems, so one shared chart often obscures the real cause of delays. If TTFB rises only for cache-miss, the cause is most often on the origin, application or database side, not in the network or CDN.
- TTFB per URL or page type, not only for the homepage.
- Breakdown by cache-hit, cache-miss and logged-in and anonymous traffic.
- User region, response status, HTTP method and handling layer: edge, proxy, origin.
- Comparison of peak hours, periods after deployment and the first minutes after a restart or autoscaling.
- Correlation with data from APM, server logs, slow query log and external service errors.
Good monitoring does not end with simply reading the number; it should lead to identifying where the delay occurred before the first byte was sent. In practice, the best approach is to tie metrics together from the CDN, reverse proxy, load balancer, web server, application and database. When the layers are clearly separated, it becomes easier to distinguish a transport issue from a slowdown in business logic. Without such a breakdown, the team often fixes the wrong area and wastes time on changes that do not translate into the first byte.
After every deployment, it is worth comparing the result against an established baseline, rather than relying on the impression that the site “seems fast”. The simplest scheme works best: release, measurement on key endpoints, comparison with the previous version and a quick analysis of the differences. If you see a rise in TTFB after deployment, it is most often caused by new middleware, additional database queries, changed cache rules or a new external integration.
It is also worth tracking situations that standard synthetic tests do not catch. Problems often only emerge after process restarts, on cold container starts, after waking up serverless functions or when traffic from a specific region spikes. Low TTFB needs to be confirmed in production conditions, because only there can you see the real cost of scaling, external dependencies and load.
Maintaining the effect requires alert thresholds and clearly assigned responsibility for response. The alert should cover not only a rise in TTFB itself, but also a drop in the cache-hit rate, longer SQL query times, growing request queues and upstream errors. This way, the team responds to the cause, rather than only to the final symptom visible in TTFB.
Finally, it is worth treating TTFB as a constant element of technical quality, not a one-off optimisation project. When new features, personalisation, security or integrations are added, the path to the first byte usually gets longer. That is why the best results come from regularly reviewing the slowest endpoints and making sure that every new change has a justified cost on the server side.
FAQ
Frequently asked questions
how do you measure TTFB so the result is really useful?
It is best measured per URL or per endpoint type, split into cache-hit, cache-miss, anonymous traffic and logged-in traffic. One average for the whole site usually obscures the picture.
does a high TTFB always mean a slow server?
No, because the delay can also arise in DNS, TLS, CDN, reverse proxy, or while the application and database are working. TTFB shows the whole request handling path, not just hosting.
why does cache have such a big impact on TTFB?
Because it lets you return a response without running the full application logic and without waiting for the database. The biggest improvement usually comes from increasing the number of responses served from cache.
what most often slows TTFB on the application side?
Often it is overly complex middleware, redirects, rewrites, lots of database queries, an N+1 issue, or synchronous calls to external services. Each of these can delay the first byte from being sent.
which backend changes help most to reduce TTFB?
It helps to reduce the number of database queries, add missing indexes, use connection pooling and simplify the logic before sending HTML. It is also worth moving less important operations to asynchronous tasks.
will simply switching to HTTP/2 or HTTP/3 improve TTFB?
It can improve transport and connection behaviour, but it will not speed up slow business logic or heavy SQL queries. If the backend is overloaded, the protocol on its own will not solve the problem.