

Performance optimisation comes down to eliminating those elements that genuinely slow loading and make the site worse to use. Usually, this is not a single fix, but a sequence of decisions concerning code, resources, the server environment and external scripts. Well-executed optimisation speeds up the appearance of key content, improves interaction fluidity and reduces the load on the browser and hosting. The most important goal is to show the user faster what they came for, rather than just achieving a high score in a testing tool. To achieve this, you first need to measure the problem, then organise the priorities, and only then implement changes. This matters because different websites have different bottlenecks and not every technique delivers a comparable effect.
What performance optimisation of a website is in practice
Performance optimisation of a website in practice is a cycle: measurement, identification of sources of slowdown, implementation of fixes and verification of whether the site is actually working faster. It does not start with random “cleaning” of the code, but with determining which views, devices and page elements are losing the most time. This makes it easier to determine whether the problem lies with the server, frontend, images, scripts or cache configuration.

In day-to-day analysis, the main things to check are the response time of the server, the way resources are fetched, first-screen rendering, the cost of JavaScript execution and the stability of the layout during loading. These are the areas that most often determine whether the user sees the page quickly and can start using it straight away. A good performance audit does not end with a list of errors, but indicates what to improve first and what will deliver the biggest business impact.
The result of optimisation should be tangible improvements: lighter resources, a shorter rendering path, fewer browser-side blocks and better interface responsiveness. Quite often this is accompanied by fixes in cache, CDN configuration, the database or the way HTML is generated. As a result, the client or team receives not only a report, but also an implementation priority plan, specific technical recommendations and a comparison of results before and after the changes were introduced.
The key thing is that performance is assessed by its real impact on the user, not by the appearance of the report itself. If the page still takes a long time to show the main content or can stutter on click, even a high score has limited value. The best results come from working on the most important subpages and key paths, rather than trying to improve everything at once.
The current technical context and its impact on performance
The current technical context affects performance mainly through the growing number of scripts, heavier frontends and the increasing importance of mobile devices. Many modern websites load a lot of JavaScript, use ready-made components and connect numerous marketing tools. This increases the rendering cost and delays the moment when the user sees the content or can interact with it.
Today, laboratory analysis alone does not give the full picture, because a synthetic test covers only a slice of the situation. It is worth comparing data from tools such as Lighthouse or PageSpeed with metrics from real users; only then can you see what is happening on weaker phones, over slower connections and in real sessions. Making decisions based solely on one score is a common mistake that ends up with misguided priorities.
In practice, Core Web Vitals still matter a great deal, namely LCP, INP and CLS, but they should not be interpreted in isolation from the technical causes. For example, a low LCP may be the result of a slow server response, an overly heavy hero image, blocking CSS or delayed HTML. Meanwhile, poor INP usually points to too much work on the main thread, most often due to excessive JavaScript and tracking scripts.
CMSs, ready-made themes, page builders and plugins also have a significant impact, because they often produce excess code and make it harder to control what is actually loading on the page. In such environments, the problem is often not one file, but the whole way the view is assembled. That is why optimisation in a CMS often comes down to choosing whether to refine the theme, limit plugins or change the caching strategy.
External scripts form a separate category, such as analytics, ads, a tag manager, consent management or widgets. Each of them can add further requests, delays and CPU load, especially on mobile. When the share of external tools is large, performance improvement becomes not only a technical task, but also a business decision about what is actually needed.
How the website performance optimisation process works
The optimisation process starts with a baseline measurement, then separates the sources of the problem, rolls out changes according to impact and finally verifies the effect after publication. First, you need to establish which views are actually slow, on which devices and at what moment the user perceives the delay. For this, one synthetic test is not enough. First, data is collected from lab tools and real users, because only combining them reveals the full scale of the problem.

After measurement comes segmentation. You need to distinguish server-side delays from browser issues, because otherwise it is easy to optimise an element that is not a bottleneck at all. In practice, you analyse TTFB, HTML generation time, cache behaviour, the number and size of files, JavaScript execution, blocking CSS and the impact of external resources.
The next step is analysing the critical rendering path, that is, everything that delays the first useful screen. This is usually where the biggest losses are visible: an oversized hero image, CSS loaded too late or too early, scripts occupying the main thread, and components launched immediately despite there being no need. If you want to improve the perception of speed, first speed up the display of key content, and only then fine-tune the rest of the site.
Only after such an analysis is it worth setting priorities. Quick fixes most often include compressing images, removing unused code, deferring some scripts and refining cache headers. Medium-complexity tasks usually concern the frontend and resource delivery configuration, while the more difficult ones touch on application architecture, the rendering approach or the backend layer.
Implementing improvements usually starts with the frontend, because that is where issues affecting LCP, INP and CLS become visible fastest. In practice, this includes image optimisation, lazy loading beyond the first screen, reducing CSS and JavaScript, code splitting, removing heavy libraries and controlling how fonts are loaded. In modern services, it is very often excess JavaScript that slows not so much the loading itself as the interface response after the page has started.
A separate stage is refining interaction responsiveness. This means shortening long JavaScript tasks, simplifying components, reducing re-rendering and moving less important actions away from the page start moment. On weaker mobile devices, the problem is often not data transfer, but the CPU cost needed to launch the interface.
At the same time, you need to ensure layout stability. Images, iframes, ads, dynamic boxes and forms should have space reserved in advance so that the page does not “jump” while loading. This also applies to fonts, which without control can change text composition and shift elements at a critical moment.
Finally comes the backend and the resource delivery layer. What matters here are cache at application and server level, CDN, compression, correctly configured cache-control, a shorter response generation path and database performance. After implementation, it is worth comparing the results before and after, going through the main user paths and making sure the improvement is visible in real-world data as well, not only in the testing tool.
The final stage is maintenance. Without monitoring, performance budgets and clear rules for adding new scripts, the effect usually fades over time. That is why good optimisation does not end with a one-off fix, but with implementing simple rules that protect the site from slowing down again.
Key decisions and priorities in optimisation
Key decisions in optimisation come down to choosing the areas that deliver the greatest business effect at the lowest possible implementation cost. There is no point in changing the entire service at once. First, you should consider the pages with the greatest traffic and importance, such as the homepage, landing page, service page, listing, form or basket.
The most important decision is what to base the diagnosis on. A score from a single tool is not enough to build a work plan. Priorities should result at the same time from user data, the waterfall, resource size, JavaScript cost, external dependencies and server response time.
In practice, the items highest on the list are usually those that block the first screen and the user’s key actions:
- too slow HTML delivery and high TTFB,
- a heavy image or component responsible for LCP,
- excess JavaScript worsening INP,
- unstable elements causing CLS,
- external scripts launched too early.
Very often, the best result comes not from further technical “tightening”, but from cutting unnecessary cost. This most often means unused plugins, duplicate libraries, oversized images, too many fonts and marketing scripts launched on every page. The cheapest optimisation is often giving up something that brings no real value.
Priorities are also worth linking to a specific metric. If LCP is the problem, the focus goes to the main element of the first screen, HTML delivery, preload only for critical resources and limiting blocking CSS and JS. If INP is suffering, you reduce the load on the main thread, shorten JavaScript tasks and defer supporting modules. With CLS, the key is reserving space for media and dynamic components and organising font loading.
You also need to take technological constraints into account. In CMSs, builders and off-the-shelf themes, the problem is often the generated code layer itself, the number of plugins, or a cache that has not been configured sensibly. In such realities, manual fixes on individual subpages only deliver part of the effect, because the source of the problem is systemic.
A separate set of decisions concerns external scripts. If the site has a lot of advertising tags, analytics, consent management and personalisation tools, a full fix without a business decision is usually out of the question. You need to establish which scripts are genuinely critical, which can be delayed until interaction, and which are worth removing altogether.
Before implementation, it is also worth tying up organisational matters. Without access to the repository, staging environment, server configuration, CDN, tag manager and error monitoring, some recommendations remain purely on paper. This matters, because even the best list of fixes will not help if the team has no way to implement them safely.
Finally, you need to make sure you are not improving the score at the expense of how the site works. Overly aggressive lazy loading, an overstuffed preload, delaying important scripts or a poorly configured cache can boost the charts, while at the same time harming UX or publishing stability. Good optimisation is one that speeds up real use of the site without breaking functionality, measurement and the deployment process.
The most common mistakes and pitfalls in optimisation
The most common mistakes in optimisation are chasing the score in the tool rather than the real user experience, and rolling out changes without first establishing what is actually slowing the site down.
In practice, someone often sees a low Lighthouse score and instinctively starts “cleaning up” everything at once. It usually ends in a mess, because server issues, frontend issues and external scripts all get lumped together. First you need to establish whether the problem is TTFB, rendering, JavaScript, external resources or layout stability.
The second trap is a lack of priorities. Evenly optimising the whole site rarely translates into a meaningful business effect. It is wiser to start with the views with the highest traffic and the real impact on conversion, and only then move down to less important subpages.
- Relying on a single synthetic test and ignoring data from real users, especially on mobile devices.
- Aggressively delaying important scripts, which improves the metric but breaks forms, the basket, navigation or analytics.
- Lazy loading that is too broad, which also covers above-the-fold elements and, instead of helping, worsens LCP.
- Excessive resource preload, which increases competition for bandwidth and loads the browser without any noticeable benefit.
- Not reserving space for images, ads, iframes and dynamic components, which increases CLS.
- Implementing cache without controlling invalidation, so the user receives outdated files or incorrect versions of the page.
A very common issue concerns external scripts. The technical team tries to improve performance, while at the same time the site is running several marketing tools, a consent system, a tag manager, chats and A/B tests. If no decision is made on which scripts are truly critical, a full performance improvement may simply be impossible.
A separate pitfall appears in CMSs, builders and off-the-shelf themes. In such systems, the source of the problem is often the theme architecture itself, the number of plugins, or an excess of automatically generated code. Manually polishing individual views does not always make sense then, because the problem returns with the next update.
Many mistakes only show up after publication. The site may score faster in a test, yet at the same time lose features, generate visual regressions or behave differently on weaker phones. Every performance change has to be checked not only on the chart, but also on real devices and in key user journeys.
How to measure and verify the effects of optimisation effectively
Effective measurement of optimisation results comes down to comparing the data before and after deployment under the same conditions, and confirming the improvement in data from real users.
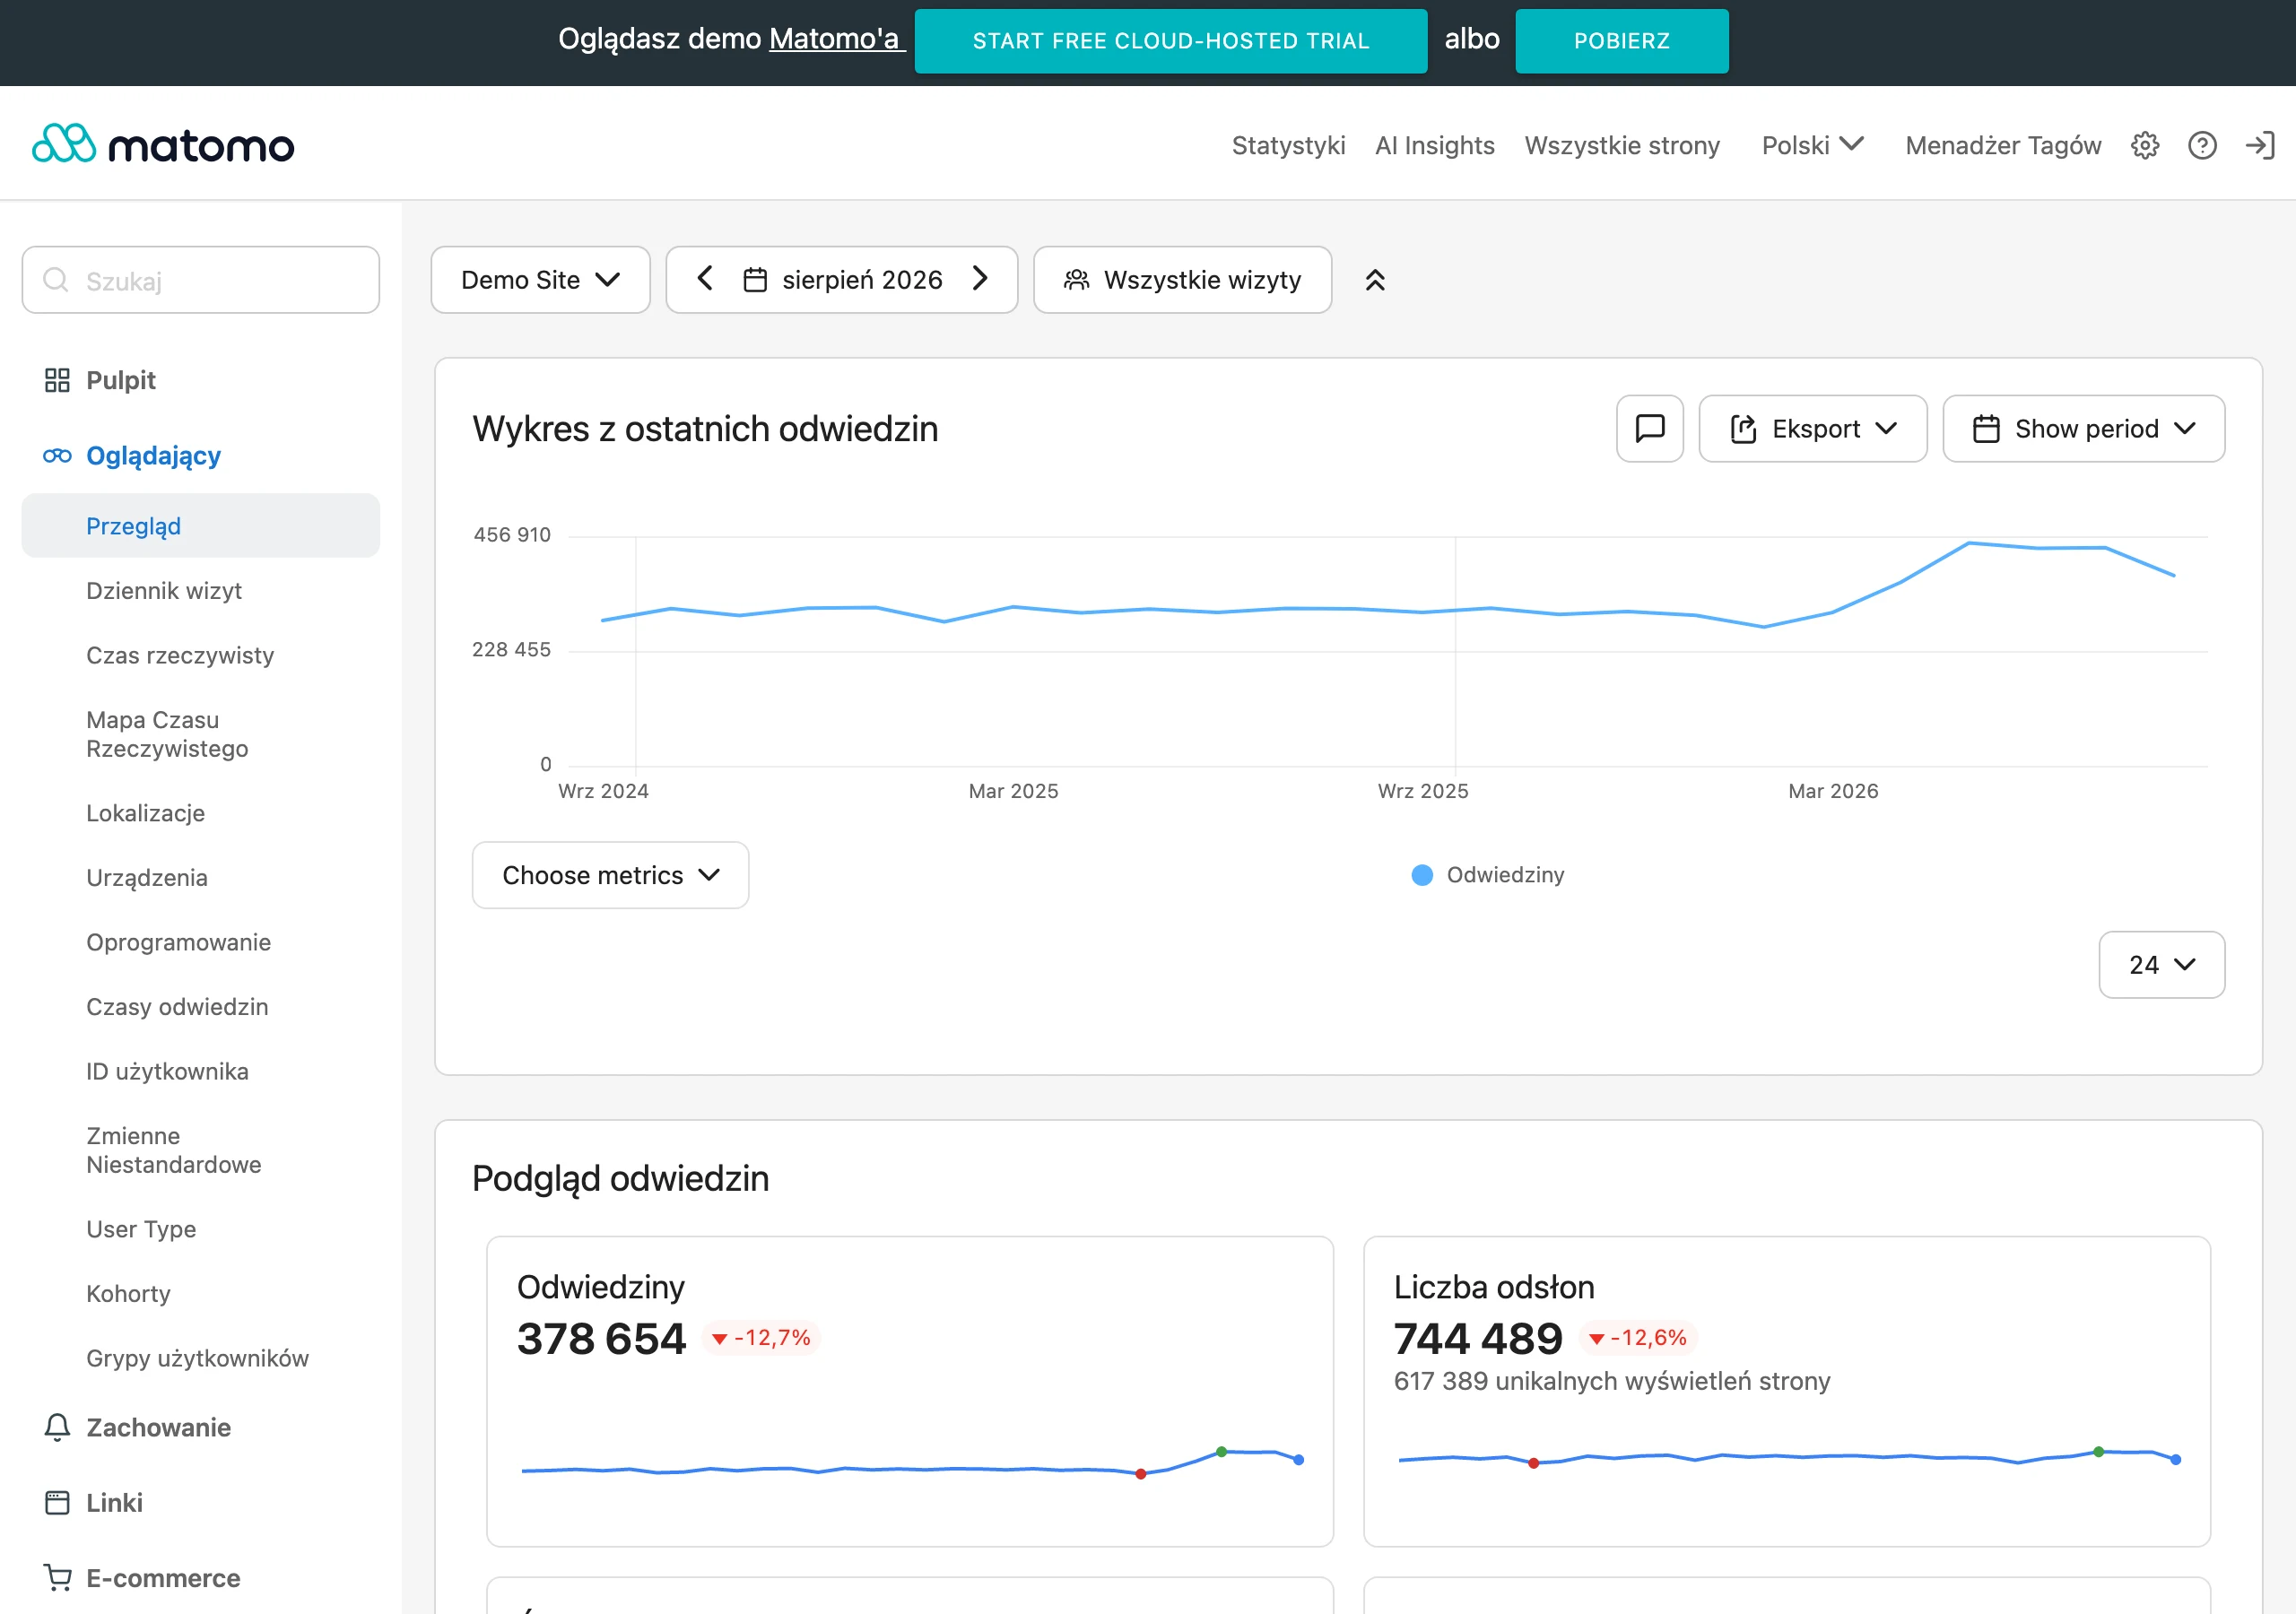
The first condition is a solid baseline measurement. You need to record results for specific subpages, devices, connection types and moments in the user journey. Without this, after deployment it is impossible to assess reliably whether the improvement results from the changes or is just the effect of different test conditions.
The best results come from combining two sources of data. Lab tests show what is specifically blocking loading and how the waterfall is arranged, while real-world data reveals what users actually see in normal traffic. Synthetic tests are excellent for diagnosis, but the effectiveness of changes should also be determined by RUM data or other measurements from real visits.
Verification should not be limited to Core Web Vitals alone. LCP, INP and CLS are important, but it is also worth monitoring TTFB, resource size, the number of requests, JavaScript execution time and the share of external scripts. If the metric has improved but the CPU cost is still high, it usually means the problem has only been partially masked.
When comparing “before” and “after”, it is crucial to stick to the same methodology. Measure the same views, on the same device configuration and with a similar network profile. If you test the homepage on desktop once and then a service page on mobile later, the result loses its comparative value.
A good habit is to segment the results. It is worth looking separately at mobile and desktop, new and returning users, views with the highest traffic, and pages with the highest business value. Quite often, one change improves one part of the site but worsens another, which means the average for the whole website can mask the real problem.
After implementation, you need to give the system time to collect data. Changes in cache, CDN, resource indexing or the structure of user traffic do not always show up in metrics straight away. First make sure that no functional errors or visual regressions occurred, and only then assess the stable impact on performance.
The most useful final report shows three elements: what was changed, what problem it addressed and what the numerical effect was for specific views. Such a report should also indicate what still could not be improved and what it depends on. This way, optimisation does not end with a one-off implementation, but turns into a controlled process.
Finally, it is worth setting simple maintenance rules. These may include image size limits, control of new scripts, monitoring of key metrics and a performance review after larger publications. Without constant control, most websites slow down again over time, even if they were well optimised at the start.
FAQ
Frequently asked questions
How does website performance optimisation work in practice?
It starts with a baseline measurement, then the sources of slowness are separated and changes are implemented according to priorities. At the end, you check whether the site really works faster after publication.
Does a high Lighthouse score on its own mean a site works well?
No, because the article stresses that the real impact on the user matters more than the score in the tool itself. A site can have a good score and still take a long time to show the main content or stutter when clicked.
Why do Core Web Vitals need to be analysed together with technical causes?
Because a low LCP, INP or CLS is only a symptom, and not always the source of the problem. Only linking the metrics with the server, CSS, JavaScript, images and external scripts shows what is really slowing down the site.
Which parts of a site most often have the biggest impact on performance?
Most often these are server response time, large images, blocking CSS, too much JavaScript and external scripts. Also important are the way the first screen is rendered and layout stability during loading.
Does optimisation in a CMS only involve removing plugins?
No, because the problem may also be the theme, the page builder, the cache configuration or the way code is generated. The article points out that sometimes you have to choose between refining the theme, limiting plugins and changing the caching strategy.
Which mistakes most often ruin website performance optimisation results?
Most often it is chasing the test score, lacking priorities and relying only on one synthetic measurement. Another common pitfall is overly aggressive lazy loading, too much preload, poorly configured cache and uncontrolled external scripts.