

DevTools is one of the most effective tools for manual SEO analysis of a single URL, especially when the standard page view does not immediately show where the problem comes from. It makes it possible to verify not only what appears on screen, but also what the browser actually fetches and interprets: HTML, scripts, resources, HTTP headers and the final DOM after rendering. This makes it possible to quickly determine whether the issue concerns indexing, rendering, performance or an implementation-side error. In practice, DevTools is used to confirm the cause of a problem on a specific page, not to carry out a general SEO “review” of the entire site. This is particularly important for pages built on JavaScript, CDN, API and dynamic components. A well-executed analysis in DevTools shortens the path from symptom to a concrete technical recommendation for the developer.
Introduction to SEO analysis using DevTools
SEO analysis using DevTools comes down to checking what exactly happens to a single page during loading and rendering in the browser. This approach is most worthwhile when the problem concerns a specific URL, a particular type of subpage or one implementation that may have changed how the template works. Instead of relying on assumptions, you can inspect the actual document status, server response, fetched resources and the final content in the DOM. This is what distinguishes DevTools from simply looking at a page with the “naked eye”.
In SEO practice, the most common tabs used are Elements, Console, Network, Performance, Lighthouse and Application. Each of them answers different questions: whether the document returns the correct status, whether the content is present in the HTML, whether scripts are breaking rendering, whether resources are blocking the page from loading and whether cache is masking the actual state of the implementation. This makes it possible to move from a symptom, for example missing content in the index, to a specific technical cause.
The key point is that DevTools does not replace a crawler or a full site audit. It will not show the scale of the problem across the whole site, but it very precisely reveals the mechanism by which it arises at the level of a single page execution. When a crawler flags missing titles, incorrect canonicals or inaccessible content, DevTools helps determine whether the problem is already present in the HTML response or only appears after JavaScript runs.
The tool is particularly useful when there are discrepancies between the source code and what is ultimately produced after rendering. In such situations, you can catch overwritten meta tags, delayed content injection, incorrect internal linking or key elements depending on a failed API request. If you want to understand why a page looks fine for users but performs badly for SEO, DevTools usually gives the quickest answer.
- 01Real-time analysisCheck loading and rendering
- 02Diagnosis of a specific URLFocus on one implementation
- 03Facts instead of assumptionsActual status and response
- 04Verification of DOM contentFinal content after rendering
- 05Key DevTools toolsAnswers to key questions
Key benefits: It distinguishes technical analysis from visual analysis, providing hard data on how the page works.
Current challenges in analysing JavaScript-rendered pages
Today’s difficulties in analysing JavaScript-rendered pages mainly stem from the fact that the content visible to the user is often not present straight away in the initial HTML. In many modern implementations, key page elements appear only after scripts run, data is fetched from the API and the interface hydration is complete. For SEO, this means the need to compare two states: the raw server response and the final DOM after rendering. Without such a comparison, it is easy to conclude that everything works, even though in practice it may not.
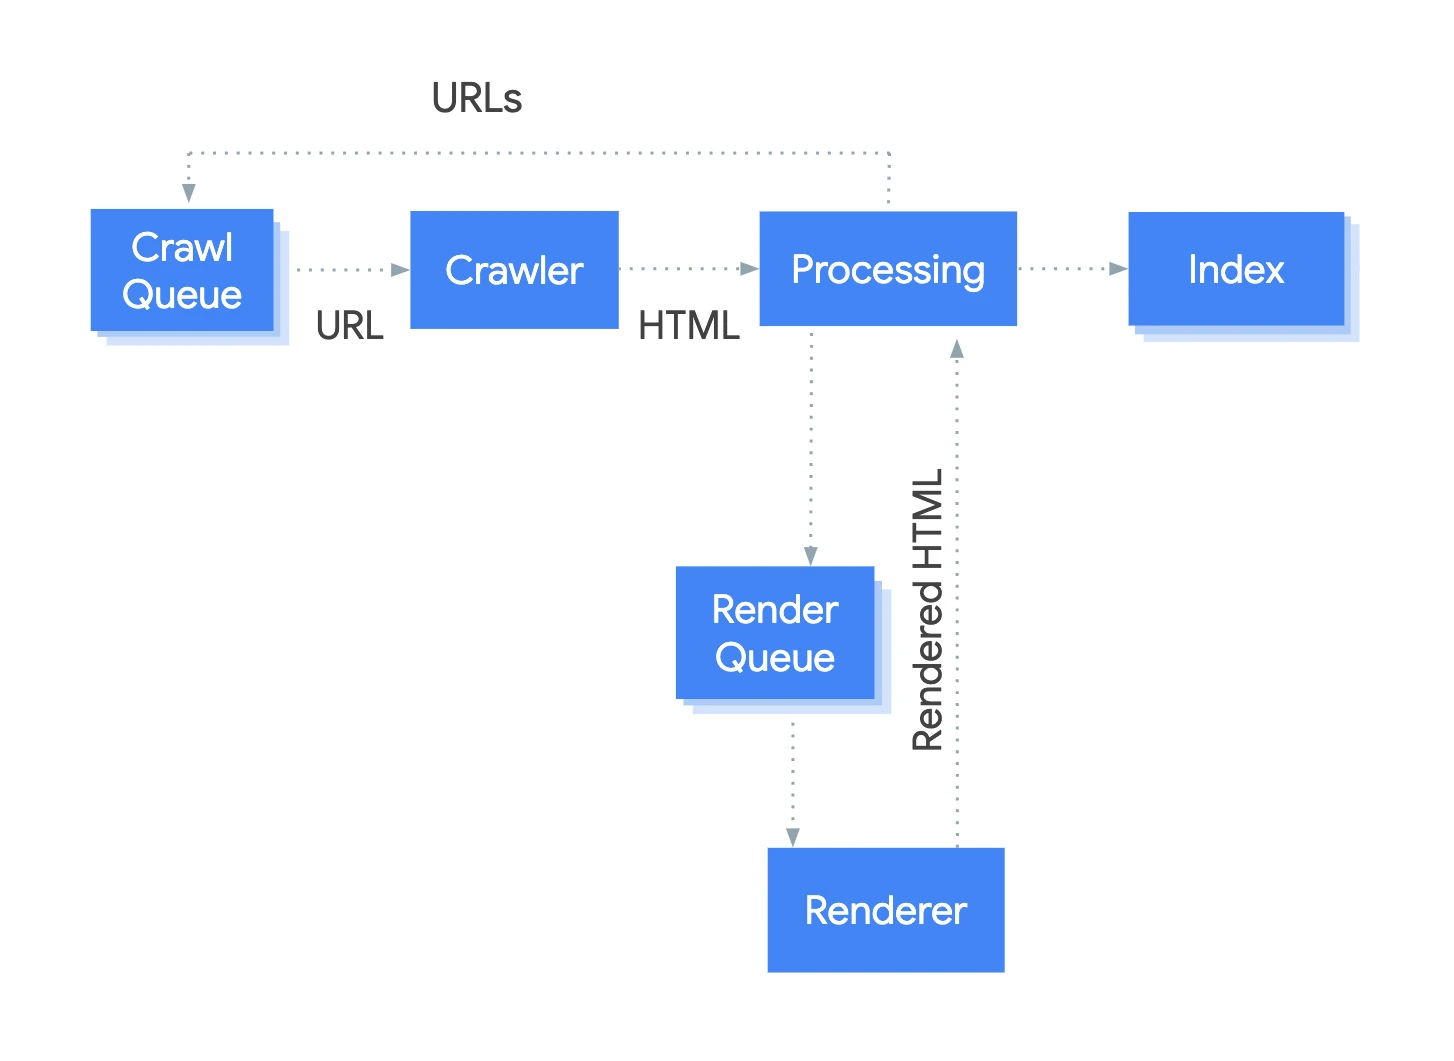
The most common problem today rarely comes down to a missing meta description; more often it results from technical faults on the implementation side. A site can have a correct template and still return the wrong HTTP status, an incorrect canonical, a robots block, or content dependent on a request that fails from time to time. From an SEO perspective, situations are particularly dangerous when the main content, category links or product data only load after a while. If an element important for SEO depends on JavaScript and an external API, you need to check not only whether it appears, but also when and under what circumstances.
Another challenge is recognising what actually hinders rendering and affects the user experience. Heavy scripts, delayed styles, external resources and long CPU tasks can cause the main content to appear too late, and the above the fold section to render in an unstable way. This matters operationally not only for Core Web Vitals, but also for the real availability of content and links in the first seconds of page load.
In practice, the results of analysing such pages can be distorted by browser cache, service worker, extensions, A/B tests, personalisation or geolocation. The same URL may behave differently on the first visit than after several refreshes, and an older version of resources can mask a current implementation error. That is why a reliable test is worth carrying out in the correct environment, with cache cleared and without add-ons that interfere with page loading. In DevTools analysis, it is very easy to draw the wrong conclusion from a good-looking screen if the test environment does not reflect a real first visit.
The problem also concerns linking itself and content structure. Some frontend interfaces use clickable containers controlled by scripts instead of real links, and some components add headings, descriptions and sections only after user interaction. From an SEO point of view, you therefore need to verify whether key elements are available without clicking, without script-driven scrolling, and without additional browser-side conditions.
Step by step: how to effectively use DevTools for SEO analysis
To use DevTools efficiently for SEO analysis, start by recreating the first page load in as controlled a setting as possible. Go to the correct URL, open DevTools, tick Disable cache and perform a hard refresh. In this way you observe the actual behaviour of the document and resources rather than the version served from the browser’s memory. Without disabling cache, it is easy to miss errors that appear only on the first visit to the site.
Next, go to the Network tab and verify the HTML document itself. The key factors are: HTTP status, redirect chain, response time and final URL. If an unintended 3xx, a 4xx or 5xx error appears at this stage, or the document loads from the wrong address, further checking of content and meta tags makes limited sense.
The next step is to check the server response and headers. Verify canonical, meta robots, content-type, cache-control and other signals affecting indexing and rendering. An incorrect canonical or blocking robots can invalidate correct content visible on the page. In practice, it is a good idea to compare what the server returns with what ultimately ends up in the DOM.
In the Elements tab, compare the final DOM with what should actually be available for SEO. Verify the title, meta description, H1, main content, internal links, structured data and alt attributes on images. If important elements appear only after JavaScript runs, assess whether this happens quickly and stably, and whether it does not depend on faulty requests.
Next, use the Console and the XHR and Fetch filters in Network to establish where the content is actually being fetched from. JavaScript errors, module issues, CSP warnings and failed API responses often explain why an important section of the page remains empty or links do not make it into the DOM. If content is based on a request that returns an error or arrives too late, the source of the SEO problem lies in rendering rather than in meta tags.
Finally, assess performance and the mobile view. In Performance or Lighthouse, check render-blocking resources, heavy scripts, long CPU tasks, layout shifts and the moment the main content appears. In mobile mode, make sure the most important elements are visible without interaction and do not disappear on a small screen.
The final stage is to record the findings in an operational format. Describe each problem by a specific URL, the place where it was detected, the condition under which it occurs, impact on SEO and the implementation recommendation. A good DevTools analysis ends with a concrete implementation task, not just an observation.
- 01Open DevTools on the URLLaunch the tools on the target page.
- 02Disable Cache and refreshRecreate the first load without memory.
- 03Verify the Network tabCheck HTML status, redirects, URL
Key takeaway: Always disable cache so you do not miss first-visit errors and can observe the actual behaviour of the document.
Practical tips for analysing pages in DevTools
Practical guidance on analysing pages in DevTools comes down to working on the right URLs, in the right conditions and in the right order. Do not start with a random subpage if the problem may affect the whole template. It is best to analyse representative page types:
- home page,
- category or listing,
- product or service page,
- article or guide,
- pagination page.
Such a sample usually quickly shows whether the error is incidental or repeats across the whole group of URLs. This is especially important with problems involving canonicals, meta robots, linking and content built from the same components.
In practice, start by verifying the HTTP status, redirects and indexing rules, and only then move on to meta tags and content. If the document returns the wrong status, redirects to another address or has indexing blocked, further conclusions can be misleading. Poor analysis order often ends up treating the symptoms rather than removing the real cause.
For pages based on JavaScript, make sure the key content and links are available without clicking, scrolling or other user actions. An element may look like a link, but if it is not a genuine tag with a valid href, its SEO value is limited. The same applies to content loaded only after a successful API call or after frontend hydration has finished.
It is also worth comparing the initial and final state of the page when the title, canonical or meta robots are overwritten by scripts. A common scenario is that the server returns one set of signals, and the frontend replaces it with another a moment later. Without checking changes in the DOM, it is easy to assume the implementation is correct, even though the final state of the page remains inconsistent.
Make sure the test conditions are right. Browser cache, service worker, A/B tests, personalisation, geolocation and extensions can change the result of the analysis or mask the real error. If the result is unstable, first exclude the influence of the test environment, and only then assess the implementation itself.
Finally, group issues by type: indexing, rendering, linking, performance, resources and structured data. This division makes it easier to assign tasks to the right person and speeds up the implementation of fixes. The report should include the checked URL, reproduction steps, a DevTools screenshot, the detected error and a clear repair recommendation.
The most common mistakes and risks when using DevTools
The most common mistakes when working with DevTools are analysing a page in distorted conditions and drawing conclusions from the wrong place. Browser cache, service worker, extensions, A/B tests and personalisation are the most misleading, because they can show a different version of the page than the one actually received by the user or bot. If you do not reproduce the first load, it is easy to assume the implementation is correct, even though the problem occurs only when entering from a clean session. In practice, a wrong test context generates more false conclusions than the page itself.
A common mistake is assessing SEO only through the lens of the view in the Elements tab. The DOM after scripts have run does not have to reflect what was available in the initial HTML and what was delivered early enough. This is especially important with frontend frameworks, hydration and content fetched from the API. The page may look correct, and yet key content, links or tags may appear with a delay or depend on a request that can be unreliable and sometimes ends in an error.
The second risk is skipping the technical fundamentals and moving straight to meta tags, headings or content. If the document has the wrong HTTP status, an unintended redirect, a robots block or an incorrect canonical, further analysis of on-page optimisation has limited value. First confirm that the URL is accessible, returns the correct document and does not send conflicting indexing signals.
Many people also rely too heavily on individual reports, especially Lighthouse. Such a result helps to identify performance issues, but by itself it does not determine indexability, rendering quality or the correctness of SEO signals. It is worth comparing it with Network, Console, Elements and the real server response. A low or high score on its own does not yet show what exactly needs to be improved.
An interpretative error also appears when one URL is analysed and the entire site is judged on that basis. DevTools shows the cause well at the level of a specific page or template, but it does not replace a crawl of the whole website. If the problem affects a category, product or pagination, check several representative URLs. Only then can you see whether it is an isolated case or a systemically implemented error.
It is also risky to ignore JavaScript errors and API requests. When content, linking or SEO tags are injected by scripts, a failure of one JS file, CSP or an unsuccessful data fetch can stop the entire render. If an important SEO element depends on an unstable script or API, treat it as a real indexing risk rather than a minor frontend fault.
- 01Distorted conditionse.g. cache, extensions
- 02No clean sessionOnly the first load
- 03Wrong test contextGenerates false conclusions
- 04Assessment only from ElementsDifferent from the initial HTML
A faulty test environment and a cursory analysis lead to false conclusions about the state of the implementation.
Metrics to monitor and verify in the SEO analysis process
In the process of SEO analysis in DevTools, it is above all worth checking whether the document is being delivered, rendered and supplemented with key signals correctly. Start with the document’s HTTP status, the final URL, the redirect chain and the server response time. These determine whether the bot receives the right page at all and whether it encounters any unplanned barriers along the way. Without this, it is hard to assess the rest reliably.
Next, check the HTML response and headers, rather than limiting yourself only to the final appearance of the page. Verify the canonical, meta robots, content-type, hreflang and other signals that may affect indexing or the way the document is interpreted. The most important thing is to compare the initial state with what appears after JavaScript has run, because it is at this stage that discrepancies often come to light. If a script overwrites the title, canonical or robots, you need to determine which variant is final and whether it behaves consistently.
The next set of signals concerns the presence of content and links. Check whether the main content, H1, internal links, structured data and alt attributes are present in the DOM and whether they are available on first load, without any user-side interaction. For links, what matters is the target a element with a real href, not a clickable container controlled by script. This matters both for crawlability and for passing signals from internal linking.
Metrics related to resources and execution errors are also important. In Network, verify 4xx and 5xx errors, missing JS and CSS files, delayed XHR or Fetch requests, as well as dependencies on external services. In Console, observe JavaScript errors, module issues, CSP and failed data fetches. If the main content or links depend on a request that does not always complete successfully, this is a priority area for improvement.
It is worth tracking performance through the lens of how it actually translates into rendering the most important part of the page. Pay attention to render-blocking resources, heavy scripts, long CPU tasks, layout shifts and the moment the main content appears. The point is not only to assess the tool’s score, but whether the key content above the fold appears quickly and remains stable. If LCP is delayed by a large image, an external script or late content retrieval, the problem has both a UX and an operational SEO dimension.
Finally, confirm that the test environment matches the actual deployment. In mobile mode, check content visibility, responsive behaviour and whether elements disappear or load differently than on desktop. In Application, review the service worker and caches to make sure you are not analysing an old version of the page. Good analysis does not end with observation alone, but with a record of what was checked, where the problem was found, in what conditions it occurs and what impact it has on SEO.
FAQ
Frequently asked questions
How do you use DevTools to analyse the SEO of a single page step by step?
First, reproduce the initial page load with cache disabled and a hard refresh. Then check the HTTP status, server response, headers, final DOM, Console errors and resources in Network.
Will DevTools show why the content is not making it into the index?
Yes, it helps establish whether the problem appears already in the HTML or only after JavaScript rendering. This makes it possible to distinguish an indexing issue from an implementation or API-side error.
Why do you need to compare HTML with the final DOM in DevTools?
Because on modern sites content often appears only after scripts run and hydration takes place. Without comparison, it is easy to miss overridden meta tags, delayed content injection or missing important elements in the DOM.
When is analysis in DevTools most useful in SEO?
Most useful when the issue concerns a specific URL, a specific template or a site built on JavaScript, CDN and API. The tool shows the cause well at page level, but it does not replace a full-site audit.
What should you check in Network during an SEO analysis?
Above all, the document status, redirect chain, response time and final URL. It is also worth reviewing XHR and Fetch requests, because they often show where the content is really being fetched from.
What errors can distort the result of a page analysis in DevTools?
Browser cache, service worker, extensions, A/B tests, personalisation and geolocation can show a different version of the page than the one actually visible to the user or bot. That is why the test should be carried out in controlled conditions, ideally in a clean session.