

Publishing a new site does not close the project. It only opens a period of intensified monitoring. In the first days after implementation, the problem is usually not one spectacular error, but several minor faults which together can chip away at traffic, conversion or data quality. That is why you need to look at technical performance, SEO, analytics and real user behaviour at the same time. After launch, you do not monitor the “new site” itself, but the effects of the launch: whether the user can enter, find content, complete the goal and whether the system records it correctly. This distinction is key, because it lets you quickly separate a critical outage from a problem that can be improved in the next iteration. The sooner you catch errors after publication, the lower the risk of losing leads, sales and visibility in Google.
What does monitoring after launching a new site mean?
Monitoring after launching a new site is the ongoing check of whether the website actually works after publication and whether it is not losing traffic, data, leads or sales along the way. It is not about the site “opening up”, but about what happens next. The data makes this clear: what matters is the effect of going live in real conditions, with real users and real intent. In practice, you test whether the user can move frictionlessly from entry to conversion. The question is: where does that process break down.
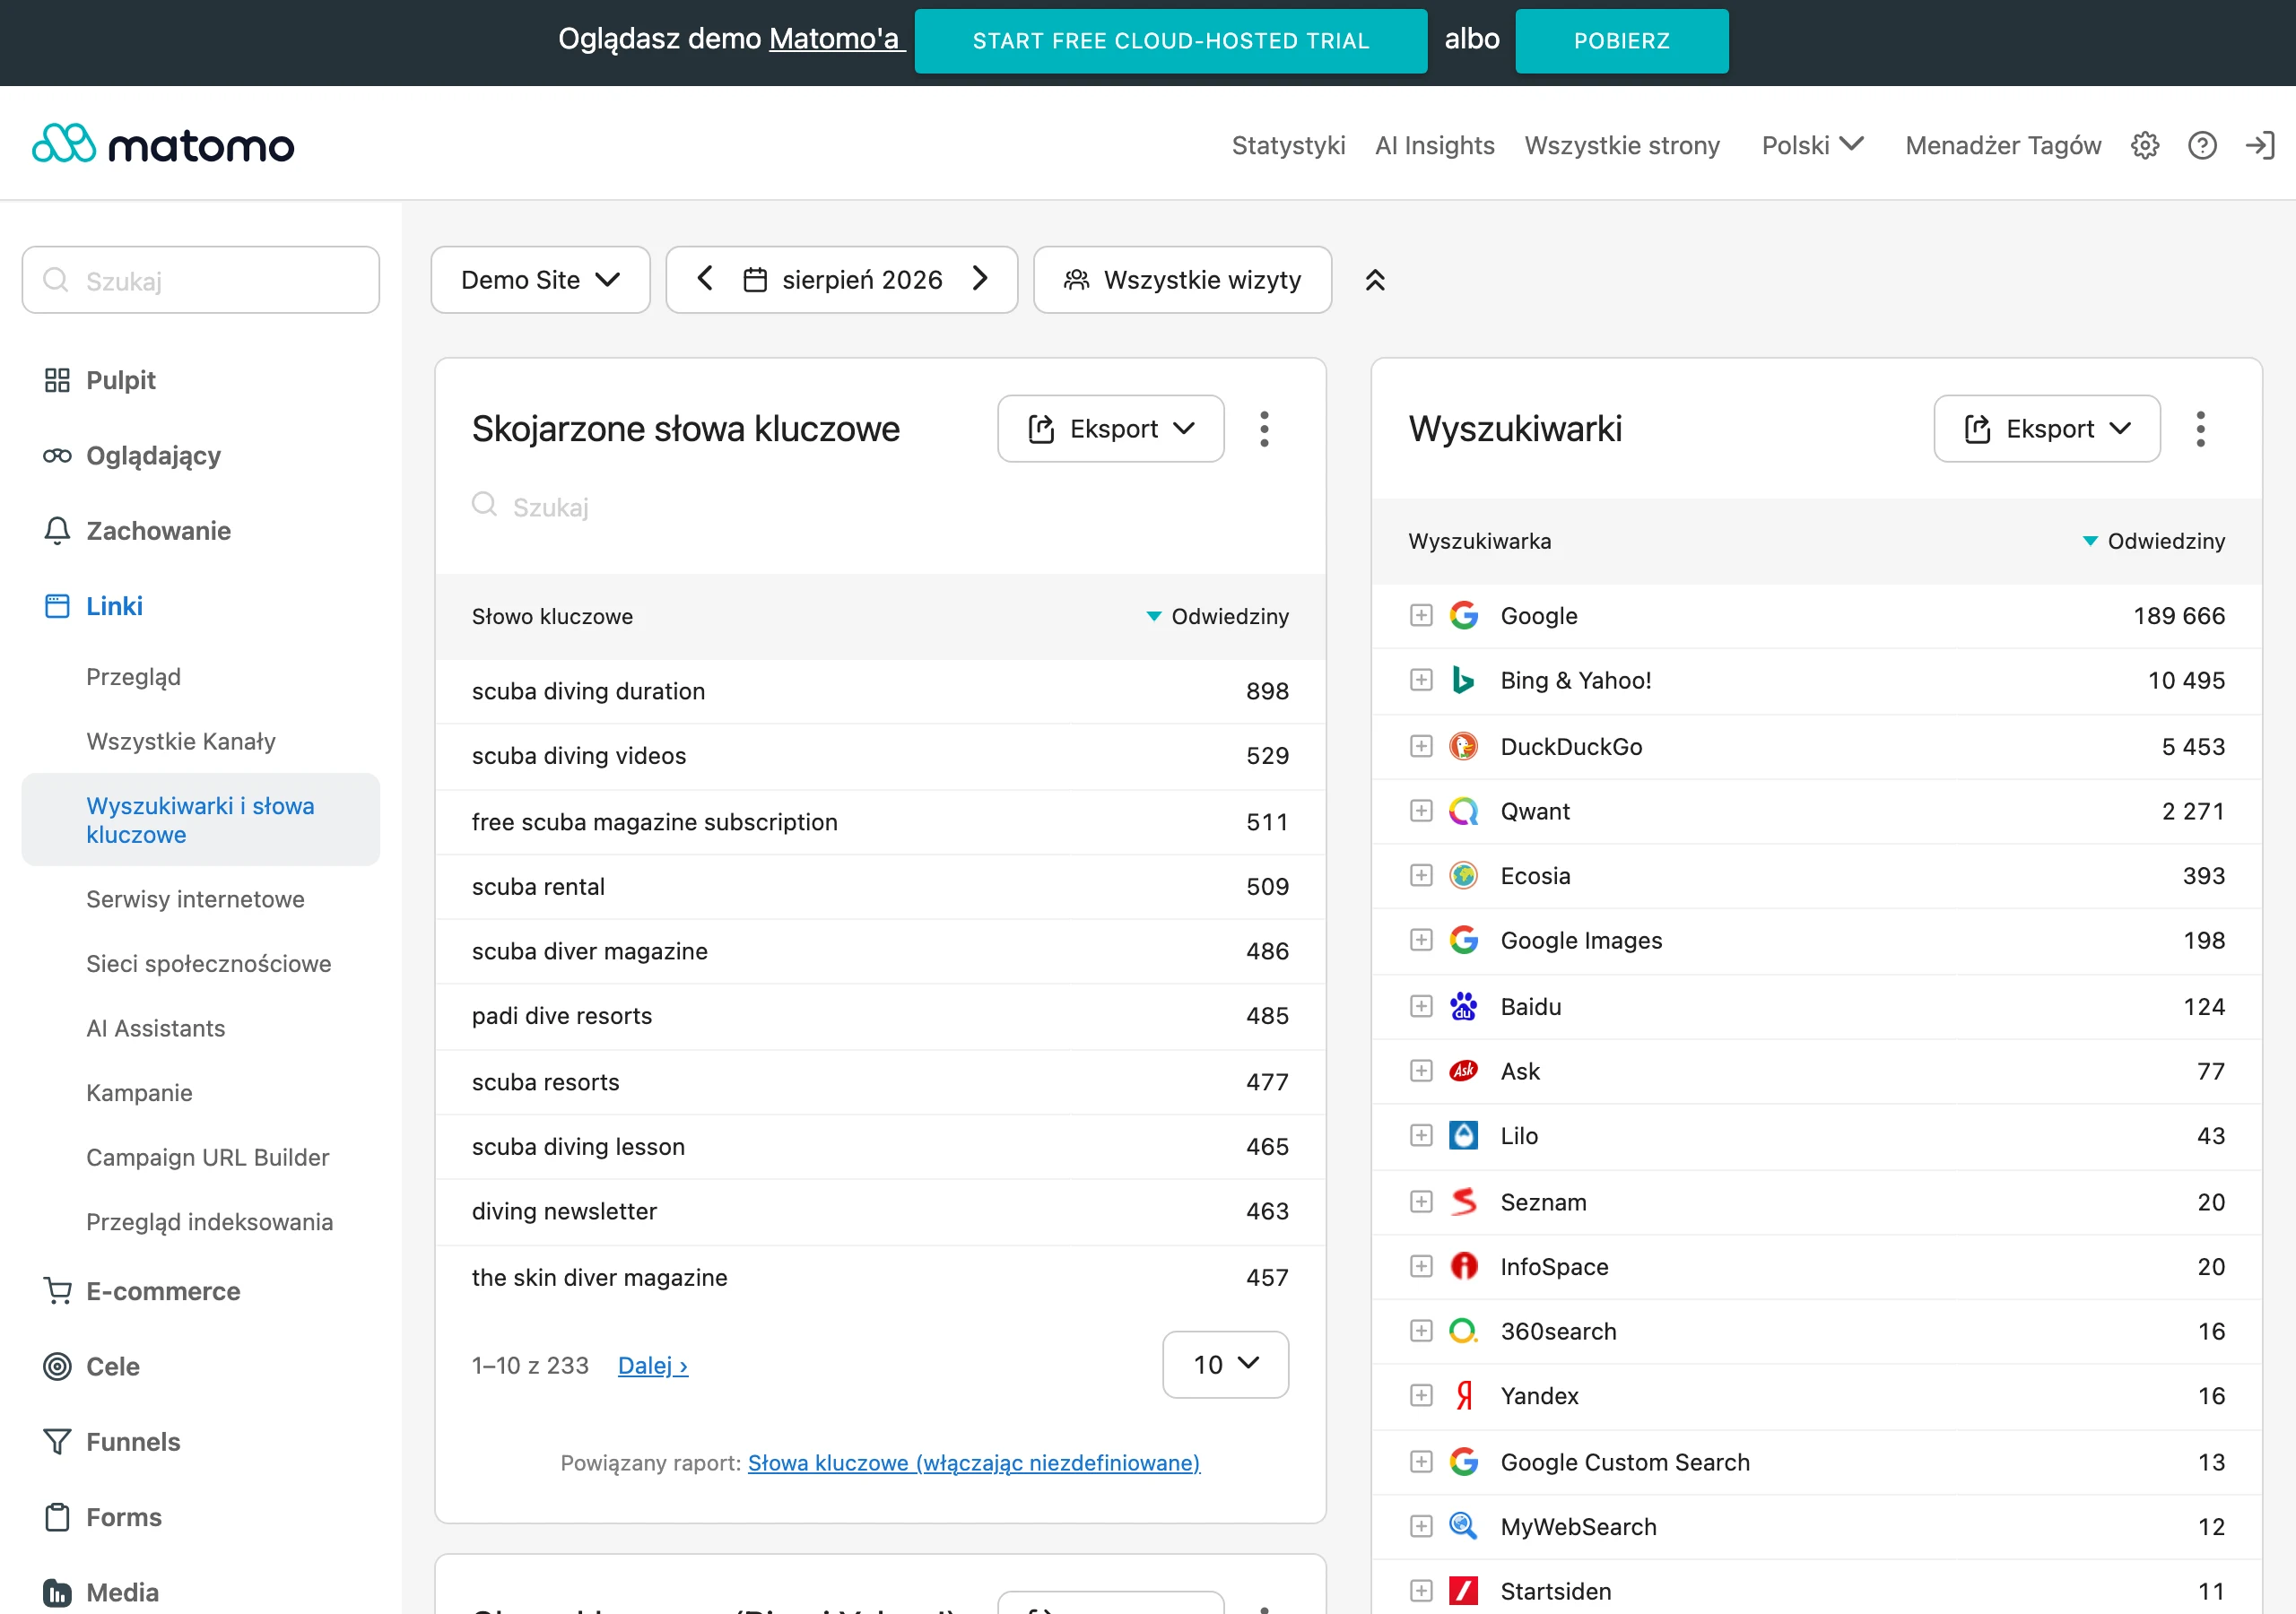
The scope of such monitoring covers several layers at once — site availability, redirects, HTTP statuses, indexing, form functionality, checkout, analytics tags, performance, JavaScript errors and security. Sounds broad. But note: after publication, some faults only appear under real traffic, when the website is under normal load and exposed to non-standard behaviour. Tests in a staging environment rarely show the full picture, because staging does not have the same scale, the same data or the same paths.
The most important thing is to quickly detect problems that block the user or distort the data. If a form does not send a message even though it looks fine, the business quietly loses leads. If GA4 does not record events or cookie consent blocks tags, you may wrongly conclude that traffic or conversions dropped “because of the new design”, when the measurement is at fault. Look at it differently: it is not the redesign that damages results, but the lack of visibility into what really happened.
Monitoring after implementation is also a decision-making process. On this basis, you determine what needs to be fixed immediately, what requires optimisation, and what is simply a natural change after a migration or redesign. Good post-publication monitoring is not about looking at a single metric, but about linking symptoms to their real cause. And that is not a cliché. One anomaly in the data may be a coincidence, two are a signal, and three is almost a diagnosis.
Key areas to monitor after publishing a site
The key areas are technical performance, analytics, SEO, UX, performance, security and business outcome. Each of them affects a different stage of how the site works: user entry, finding the site in search, completing the goal and measurement accuracy. Not X, but Y: it is not enough to ask “does it work”, but “does it work and measure correctly”. If you omit even one of these areas, it is very easy to draw the wrong conclusions and fix the wrong thing.
- Technical performance and accessibility — correct functioning of the domain, SSL, redirects, 200/301/404/500 statuses, robots.txt, sitemap.xml and URL versions.
- Analytics — page_view, events, conversions, e-commerce, GTM, data layer, cross-domain, UTM and compliance with cookie consent.
- SEO — indexing, crawl errors, canonicals, noindex, mapping old URLs, internal linking, metadata and structured data.
- UX and critical paths — forms, CTA, login, basket, checkout, search, thank-you pages and mobile performance.
- Performance and stability — Core Web Vitals, server response time, JS errors, heavy scripts, cache, CDN and uptime.
- Business outcome — leads, transactions, conversion rate, abandonments, as well as the effectiveness of key landing pages and channels.
Technical performance determines whether the site actually makes it to the finish line. And whether bots and people land where they actually should. Right after launch, you check 301 redirects, 404 and 5xx errors, the HTTP/HTTPS variant and the www/non-www setup. The problem is that this is exactly where faults are easiest to miss, yet they can cut off SEO and block the user’s path in one move.
Analytics answers a simpler question. Can you trust the numbers after publication. In GA4’s event-based model, it is not enough to see a page view, because events, conversions, revenue, form parameters and compliance with the data layer in GTM are just as important. A poorly implemented consent banner or a tag conflict can create a gap in reports that looks like a drop in performance.
SEO after deployment is monitored separately. Not out of caprice, but because problems often stem from address migration, template changes and blocks for robots. In practice, you check indexing, clicks and impressions in Google Search Console, fresh crawling errors, lost landing pages and the state of the sitemap. If the old URL structure was not mapped correctly, visibility can drop faster than you manage to notice it.
UX, performance and business outcome need to be looked at as a package. The user does not separate these layers. A page can be indexed and technically correct, but if the CTA does not work on mobile, the form churns endlessly, or checkout freezes at payment, conversion drops without question. The key is to test real user scenarios and confront them with data on leads, sales and abandonments.
What problems can occur after launching a new website?
After launching a new website, technical errors, gaps in analytics, SEO issues, failures in conversion paths and performance drops usually surface. It sounds broad. And it is, because some things are visible straight away, but a lot only emerges with real traffic, on specific devices or after Google robots come in. The most dangerous issues are not single faults, but several minor errors that start working at the same time.
On the technical side, redirects, HTTP statuses and domain configuration most often fall apart. Old addresses do not redirect to new ones, create 301 chains or end in 404s. On top of that, there may be an active noindex, a faulty robots.txt, the wrong domain version or an issue with the SSL certificate.
In SEO, what most often falls apart is what you cannot see straight away. Canonicals, structured data, headings or chunks of content suddenly disappear, and the sitemap keeps feeding robots outdated addresses. If the URLs changed after deployment and the mapping of old addresses was not completed, a drop in visibility is very likely.
The second trap is analytics and cookie consent. In GA4, page_view, events, transactions or leads can fail to come through, even though the user feels that everything is working as it should. The opposite also happens: events are counted twice, cross-domain is set up badly, and the consent banner cuts measurement more than was assumed.
UX and sales do not forgive small mistakes. The elements that most often break are forms, CTA buttons, login, basket and checkout, that is, the places where the user is meant to “just click” and move on. A form can look perfect and still fail to send the message, while a transaction can go through in the payment system without the revenue data being saved in analytics. Every critical journey needs to be checked manually from the landing page through to the thank-you page.
In practice, a large share of errors affects only a slice of the site, so looking at things “globally” can be misleading. The problem may occur only on mobile, only on a specific template, only in organic traffic or only for users on a given browser. And the question is: where exactly does it break. This matters, because global reports can hide a real problem beneath the average.
How to effectively monitor site performance and stability?
Monitoring performance and stability is not one measurement, but the parallel tracking of speed, errors, availability and how the user experiences these setbacks. A one-off test after publication is not enough, because a site can shine in the lab and then struggle under real load and on real devices. The best results come from combining tool-based tests with data from actual users.
To start with, it is worth keeping an eye on: Core Web Vitals, server response time, resource size and the loading of key views. PageSpeed Insights and Lighthouse will bring issues in code, images, fonts and scripts into focus, but they will not tell the whole story of how the site behaves under real traffic. That is why it makes sense to compare lab results with browser data and server logs (there is often more to see there than in the report).
Service stability is measured hard: uptime, 5xx errors, JavaScript errors and the behaviour of external integrations. A site may load, but if the form, payment or chat script blocks interaction, the user still will not achieve the goal. In practice, it is worth setting alerts for missing transactions, a rise in 5xx, a drop in page_view and the unavailability of key subpages.
After deployment, many problems come from the front end and marketing scripts. Heavy libraries, poorly inserted tags, a lack of image optimisation, incorrect cache or a script conflict can weigh down the site without any change in hosting. When performance drops after publication, the first thing to check is the new elements added to the template, and only then the infrastructure. It is a simple rule, but it works surprisingly often.
Monitoring should also cover specific templates and devices, not just the homepage. A product listing shows something different, a service page shows something different again, and the blog or checkout even more so. Most performance problems show up on mobile, because that is where an overloaded front end and overly heavy resources become visible fastest.
The most practical model is simple. Every day you check critical signals in the first days after deployment, and then you return to the topic after each major change. This way you will distinguish a temporary slowdown from a lasting regression that will eat into results for weeks. If the site is fast in a test, but form or basket abandonment rises, the problem may be the stability of interactions, not the loading time itself.
How to ensure analytics accuracy after deployment?
Analytics accuracy after deployment comes down to one thing: you make sure that every key user action is recorded in the data exactly once, with the correct parameters and in the right reporting place. Seeing traffic in GA4 is not enough — the question is whether the measurement is faithful. After publication, it is usually not pageviews that fall apart, but events, conversions, e-commerce attributes, cookie consent and cross-domain connections. The most important thing is to test full user journeys, not just look at individual events in the preview.
In practice, you manually go through the key paths. Visiting the landing page, clicking the CTA, submitting the form, going through the basket, payment, login or registration. Each such step should leave a trace in GA4 and — if you use GTM — also in debug view and the data layer. If any stage works visually but does not record the event, or records it twice, the reports will start distorting the result faster than you can spot it in the dashboard.
You also verify the consistency of naming and parameters separately. This means event names, form values, traffic sources, product IDs, revenue, currency and thank-you pages. After implementation, the common problem is not a lack of data, but data that is only partly correct, which means decisions are wrong despite seemingly complete reports.
Cookie consent mechanics matter a lot. If the consent banner blocks tags too broadly or fires them before acceptance in the wrong way, gaps will appear in sessions, conversions and attribution — and this is not a minor issue. This is especially important when comparing results before and after implementation, because an apparent drop in traffic or leads may result from consent configuration, not from a real decline in the site.
First, sort out the technicalities. They can throw analytics off without any front-end warning. Most often it comes down to cross-domain, UTM parameters, passing transaction IDs, page_view behaviour with JavaScript changes, and making sure you do not duplicate tags when code is added to the site by several methods at once. If, after implementation, sessions, users or transactions suddenly rise or fall irrationally, you check the implementation first, and only then the audience behaviour.
At the finish, compare the data with what you had before publication. The best approach is to compare traffic, conversions, conversion rate and the results of the main landing pages by device, channel and goal type. Breaking it down like this immediately tells you whether the problem affects the whole site, only mobile, only forms, or only paid or organic traffic.
What tools are essential for monitoring SEO?
Without SEO monitoring after implementation, it is easy to wander around in the dark. You need tools that show indexing, technical errors, robot behaviour and real changes in search traffic. The foundation is Google Search Console, because that is where problems with the sitemap, indexation status, crawling errors, click drops and loss of landing pages appear fastest. And the question now is: does Google see the new site as you assumed, or only as you think it does.
The second group is technical crawlers. They scan the site in a similar way to a search robot, so instead of guessing, you get a hard report. Thanks to them, you can catch 404s, soft 404s, incorrect redirects, 301 loops and chains, bad canonicals, missing headings, duplicate metadata, orphan pages and incorrect URLs in the sitemap. If the URL structure changed after implementation, a crawler is one of the fastest ways to find SEO losses.
Then there are server logs. They show what robots really visit and how the server responds to their requests, without filters or interpretation. On a small site they are not always needed every day, but after a larger migration they can decide the diagnosis. They let you confirm whether Googlebot reaches the right pages, does not waste time on incorrect URLs and does not get stuck in redirects or resources blocked by the configuration.
PageSpeed Insights and Lighthouse are also useful for assessing elements affecting technical SEO. These are not substitutes for Search Console or a crawler, rather a torch for checking performance on the user side. This is where problems with rendering, render-blocking resources and Core Web Vitals come to light. After implementation, a drop in visibility may result not only from indexing, but also from a heavy front-end that harms accessibility and site usability.
In practice, you still need analytics. Because SEO does not end with rankings or indexing, but with what the user does after arriving on the site. GA4 helps you check whether organic traffic lands on the right pages, whether important landing pages have disappeared and whether users from search still complete goals. This makes a difference especially when the number of clicks looks stable, yet the quality of traffic or conversion clearly drops after implementation.
The best result comes from combining these sources, not clinging to one dashboard. Search Console will show the symptom, the crawler will indicate the scale of the problem, logs will confirm robot behaviour, and analytics will answer whether the error affected the business. Only this combination allows you to distinguish a visibility problem from a problem with measurement, content, linking or the site’s usability itself.
The most common pitfalls and mistakes after launching a new site
The most common pitfalls after launching a new site are deceptively effective. They cut off traffic, break measurement or simply block the user’s path to the goal. In practice, the most dangerous are often the problems you cannot see from the homepage level, and which only emerge in SEO, forms, the basket, cookie consent and integrations. Quite often everything looks “nice”, while at the same time organic traffic drops, leads do not enter the CRM or transactions are not recorded in analytics. After implementation, you have to assume that some errors will only appear under real traffic and on real devices.
A very common problem is indexing and URL migration. It only takes a left-behind noindex, a block in robots.txt or a missing portion of 301 redirects for Google to stop reading the site correctly and passing traffic to the new URLs. Then you get a snowball effect: incorrect canonicals, an outdated sitemap.xml, loss of headings and content, weakened internal linking. If the URLs changed after implementation, the lack of full mapping of old URLs is one of the fastest ways to lose visibility.
The second major group is analytics errors, in other words a false picture of the situation. GA4 may show page views but not record form submissions, purchases, revenue or campaign source, or it may be working with double counting of events. The problem is that the culprit is often mundane: a changed data layer, incorrectly set up GTM, a cross-domain issue or incorrect cookie consent handling. No data after launch does not always mean a drop in performance; sometimes it simply means broken measurement.
Errors in the user’s critical paths are costly too. A form may submit but not deliver the email, checkout may let some payments through with an error, and a CTA button may work on desktop but not on mobile. Worse still, such issues often do not show up in staging tests. They appear only when integrated with production email, a payment gateway, a CRM system or after a script conflict.
Another trap is a drop in performance and stability after publication. A new template, heavy marketing scripts, unoptimised images and fonts, cache or CDN errors, and JavaScript issues can noticeably increase page load times, especially on mobile devices. And then the mechanism is ruthless: bounces rise, conversions fall, and hard-to-pinpoint rendering errors appear. If the site is “prettier” but noticeably heavier, the user will usually feel it faster than the design team.
You must not overlook infrastructure and security either. A faulty SSL certificate, the wrong domain variant, DNS issues, server overloads or spikes in 5xx responses sometimes look like minor “temporary blips”, but in reality they cut off visits and eat away at trust. The question is: why try to salvage traffic later if you can avoid losing it in the first place? In practice, it is better to check straight away whether the HTTPS version works, whether there is a conflict between www and non-www, and whether uptime monitoring catches even short interruptions.
The most common organisational mistake is banal in mechanism, costly in consequences. The team finishes work at the moment of publication, as if launch were the finish line rather than only the first lap. Meanwhile, after deployment you need a quick review of issues, clear priorities and an owner for each area: SEO, analytics, development and the business. Most losses are caused not by the errors themselves, but by a reaction that comes too late to errors that were already visible in the first hours or days after launch. And that is not a cliché. It is simple arithmetic of time and traffic.
FAQ
Frequently asked questions
What should you monitor after launching a new site?
You need to check technical factors, analytics, SEO, UX, performance, security and business results. The point is whether a user can enter the site, move through the journey and whether the system records it correctly.
Why can leads or sales drop after publishing a new site?
The most common cause is small errors that block forms, checkout or other key user journeys. Sometimes the problem is not the site itself, but analytics that records the data incorrectly.
Should you check Google Analytics 4 and GTM after launching a new site?
Yes, because after publication events, conversions, the data layer or tag compatibility in GTM often break. If measurement does not work properly, reports can show a false drop in performance.
What usually breaks in SEO after a site change?
The most common problems concern redirects, indexing, canonicals, robots.txt, sitemap.xml and mapping old URL addresses. If the URL structure has changed and was not mapped properly, visibility can drop quickly.
How do you check whether a site works properly across the whole user journey after launch?
You need to manually go through the most important scenarios: entering the site, clicking the CTA, form, basket, payment, login and thank-you page. Testing on mobile is also important, because that is often where issues appear that are not visible on desktop.
When should you check performance and errors after launching a new site?
Ideally every day in the first few days after publication, and then after every major change. This makes it possible to quickly distinguish a temporary dip from a lasting regression that can reduce results for weeks.